With Google releasing more information of when updates take place, you should see it as a good practice to highlight this information in your Google Analytics account.
With the use of annotations, you will now have a visual guide in Google Analytic’s reports to help understand if you have been affected negatively or positively from the updates made to Google algorithm. But you can also use this to mark other important events for when changes have been applied to your website.
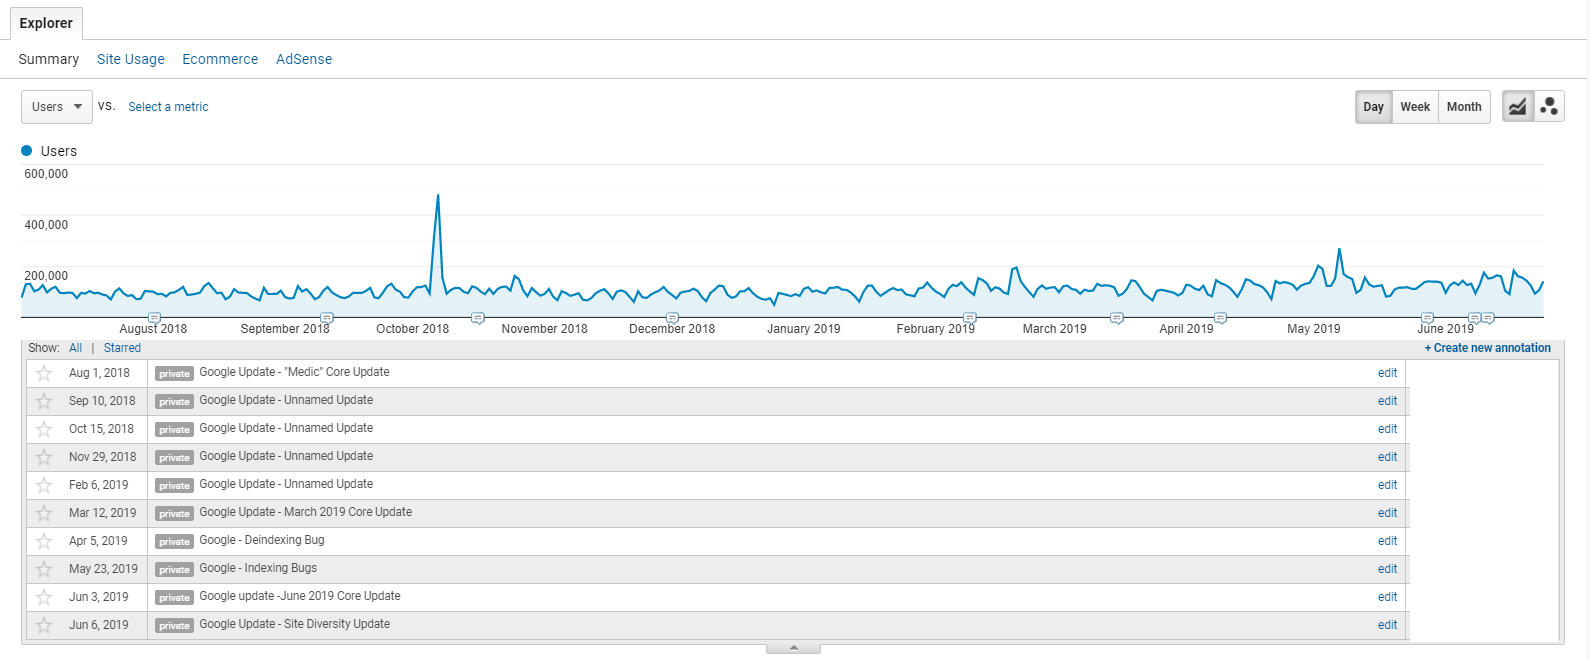
Source: Google Analytics
A four-step guide to creating an annotation
- Click on the small down arrow pointing triangle of any graph type of report.
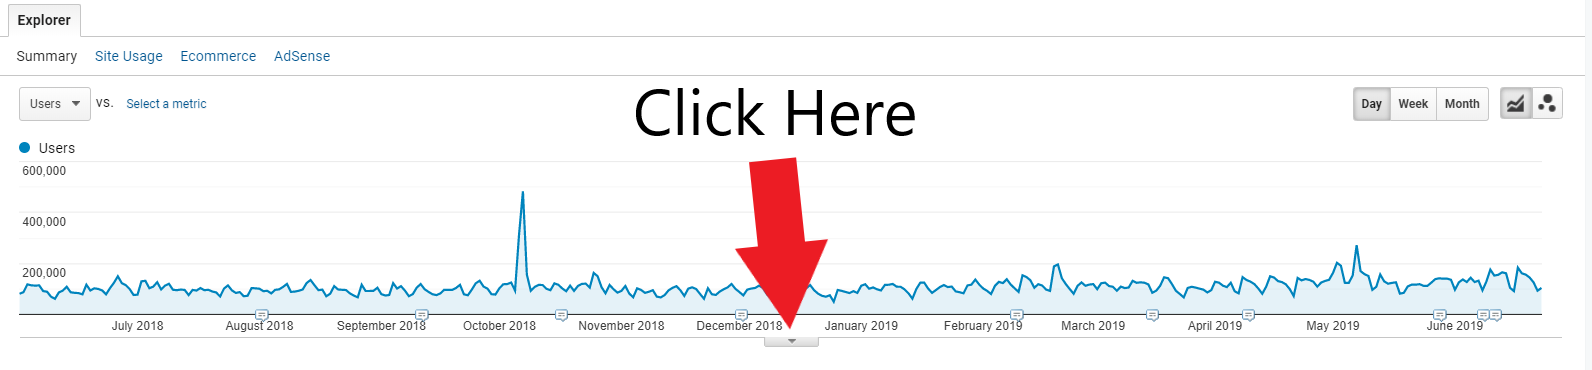
Source: Google Analytics
2) Click on the “+Create new annotation”.
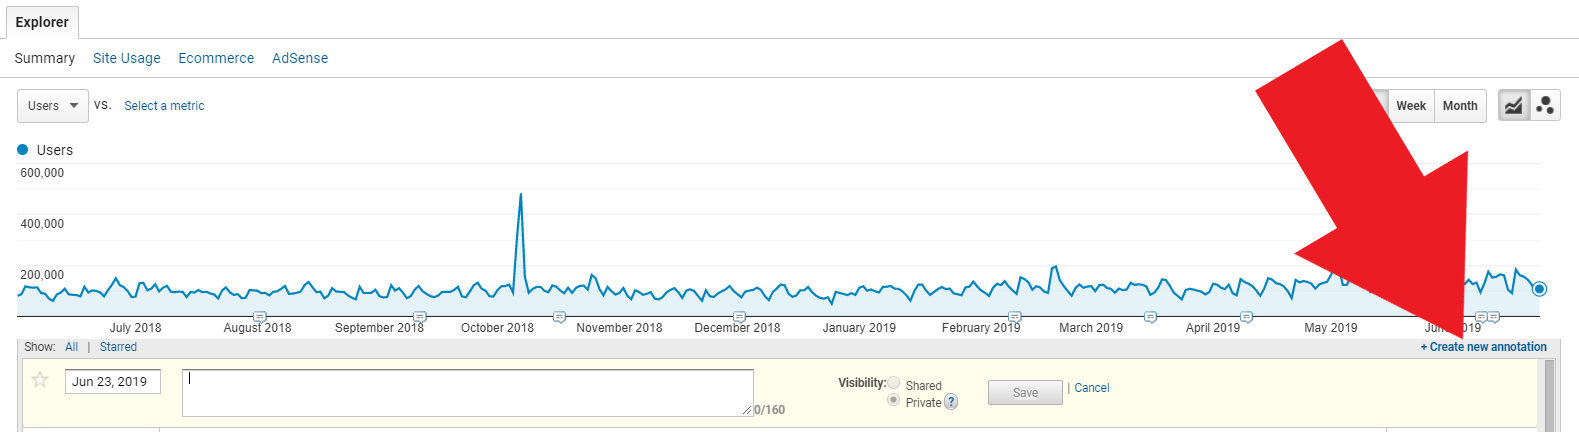
Source: Google Analytics
3) Complete the small form, select the date of the Google update and a small note that makes it clear what update/change took place.
4) And last but not least hit “Save”.
You can set your annotations to be private or shared (only if you have collaboration-level access the Google Analytics account can you select shared annotations).
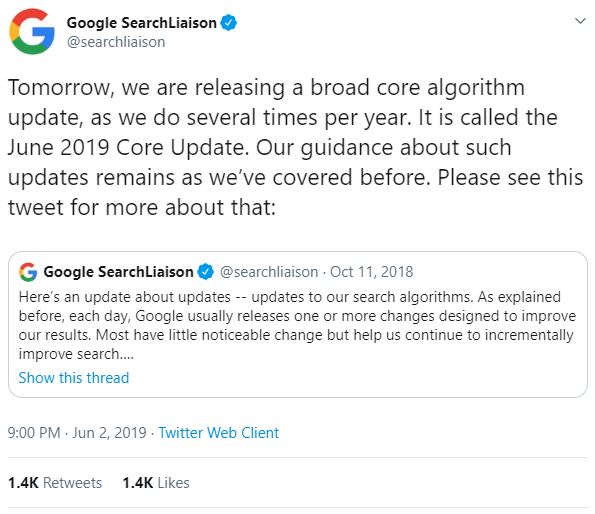
Source: Twitter.com
When Google released the June core update in 2019, Google’s search liaison team pre-announced the update via Twitter, this is the first time they have ever done this. You can take advantage of this in the future by adding google annotations in advance so that you can see if there was a negative or positive effect on your organic traffic from google.
Having the ability to add annotations with a date set in the future can come in particularly handy if you know that there is an update about to go live from Google, or if your development team is about to upload their weekly change at 4.59 pm on a Friday.
How to add annotations for future Google updates
- Go to the admin section of your Google Analytics account
- Select the correct view in the far left-hand column
- Under “Personal tools & Assets”, select “Annotations”
- Click on “+ New Annotation” at the top of the table
- Enter the date of the Google update/change you will see that you are now able to select a date in the future
- Add some descriptive text about the change/update
- Chose the type of visibility – private or shared
- Click “Create Annotation”
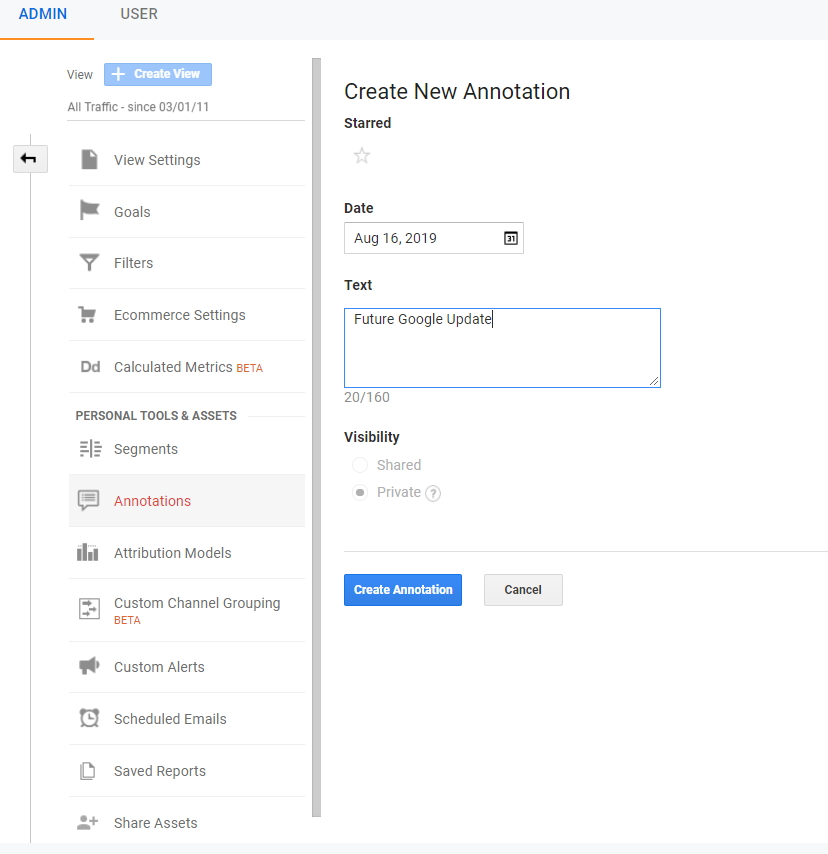
Source: Google Analytics
Share this article
Related articles
List of Google updates to add Google Analytics annotations
Site Diversity Update — June 6, 2019
June 2019 Core Update — June 3, 2019
Indexing Bugs — May 23, 2019
Deindexing Bug — April 5, 2019
March 2019 Core Update — March 12, 2019
19-result SERPs — March 1, 2019
March 1st Google Search Algorithm Ranking Update – Unconfirmed (SER)
Unnamed Update — November 29, 2018
Unnamed Update — October 15, 2018
Unnamed Update — September 10, 2018
Medic Core Update — August 1, 2018
Chrome Security Warnings (Full Site) — July 24, 2018
Unnamed Update — July 21, 2018
Mobile Speed Update — July 9, 2018
Video Carousels — June 14, 2018
Unnamed Update — May 23, 2018
Snippet Length Drop — May 13, 2018
Unnamed Core Update — April 17, 2018
Mobile-First Index Roll-out — March 26, 2018
Zero-result SERP Test — March 14, 2018
Brackets Core Update — March 8, 2018
Unnamed Update — February 20, 2018
Maccabees Update — December 14, 2017
Snippet Length Increase — November 30, 2017
Unnamed Update — November 14, 2017
Featured Snippet Drop — October 27, 2017
Chrome Security Warnings (Forms) — October 17, 2017
Unnamed Update — September 27, 2017
Google Jobs — June 20, 2017
Unnamed Update — May 17, 2017
Google Tops 50% HTTPS — April 16, 2017
Fred (Unconfirmed) — March 8, 2017
Unnamed Update — February 6, 2017
Unnamed Update — February 1, 2017
Intrusive Interstitial Penalty — January 10, 2017
Unnamed Update — December 14, 2016
Unnamed Update — November 10, 2016
Penguin 4.0, Phase 2 — October 6, 2016
Penguin 4.0, Phase 1 — September 27, 2016
Penguin 4.0 Announcement — September 23, 2016
Image/Universal Drop — September 13, 2016
Possum — September 1, 2016
Mobile-friendly 2 — May 12, 2016
Unnamed Update — May 10, 2016
AdWords Shake-up — February 23, 2016
Unnamed Update — January 8, 2016
RankBrain* — October 26, 2015
Panda 4.2 (#28) — July 17, 2015
The Quality Update — May 3, 2015
Mobile Update AKA “Mobilegeddon” — April 22, 2015
Unnamed Update — February 4, 2015
Pigeon Expands (UK, CA, AU) — December 22, 2014
Penguin Everflux — December 10, 2014
Pirate 2.0 — October 21, 2014
Penguin 3.0 — October 17, 2014
In The News Box — October 1, 2014
Panda 4.1 (#27) — September 23, 2014
Authorship Removed — August 28, 2014
HTTPS/SSL Update — August 6, 2014
Pigeon — July 24, 2014
Authorship Photo Drop — June 28, 2014
Payday Loan 3.0 — June 12, 2014
Panda 4.0 (#26) — May 19, 2014
Payday Loan 2.0 — May 16, 2014
Unnamed Update — March 24, 2014
Page Layout #3 — February 6, 2014
Authorship Shake-up — December 19, 2013
Unnamed Update — December 17, 2013
Unnamed Update — November 14, 2013
Penguin 2.1 (#5) — October 4, 2013
Hummingbird — August 20, 2013
In-depth Articles — August 6, 2013
Unnamed Update — July 26, 2013
Knowledge Graph Expansion — July 19, 2013
Panda Recovery — July 18, 2013
Multi-Week Update — June 27, 2013
Panda Dance — June 11, 2013
Penguin 2.0 (#4) — May 22, 2013
Domain Crowding — May 21, 2013
Phantom — May 9, 2013
Panda #25 — March 14, 2013
Panda #24 — January 22, 2013
Panda #23 — December 21, 2012
Knowledge Graph Expansion — December 4, 2012
Panda #22 — November 21, 2012
Panda #21 — November 5, 2012
Page Layout #2 — October 9, 2012
Penguin #3 — October 5, 2012
August/September 65-Pack — October 4, 2012
Panda #20 — September 27, 2012
Exact-Match Domain (EMD) Update — September 27, 2012
Panda 3.9.2 (#19) — September 18, 2012
Panda 3.9.1 (#18) — August 20, 2012
7-Result SERPs — August 14, 2012
June/July 86-Pack — August 10, 2012
DMCA Penalty (“Pirate”) — August 10, 2012
Panda 3.9 (#17) — July 24, 2012
Link Warnings — July 19, 2012
Panda 3.8 (#16) — June 25, 2012
Panda 3.7 (#15) — June 8, 2012
May 39-Pack — June 7, 2012
Penguin 1.1 (#2) — May 25, 2012
Knowledge Graph — May 16, 2012
April 52-Pack — May 4, 2012
Panda 3.6 (#14) — April 27, 2012
Penguin — April 24, 2012
Panda 3.5 (#13) — April 19, 2012
Parked Domain Bug — April 16, 2012
March 50-Pack — April 3, 2012
Panda 3.4 (#12) — March 23, 2012
Search Quality Video — March 12, 2012
Venice — February 27, 2012
February 40-Pack (2) — February 27, 2012
Panda 3.3 (#11) — February 27, 2012
February 17-Pack — February 3, 2012
Ads Above The Fold — January 19, 2012
Panda 3.2 (#10) — January 18, 2012
Search + Your World — January 10, 2012
January 30-Pack — January 5, 2012
December 10-Pack — December 1, 2011
Panda 3.1 (#9) — November 18, 2011
10-Pack of Updates — November 14, 2011
Freshness Update — November 3, 2011
Query Encryption — October 18, 2011
Panda “Flux” (#8) — October 5, 2011
“Minor” Google Panda Update On November 18th (SEL)
Panda 2.5 (#7) — September 28, 2011
516 Algo Updates — September 21, 2011
Pagination Elements — September 15, 2011
Expanded Sitelinks — August 16, 2011
Panda 2.4 (#6) — August 12, 2011
Panda 2.3 (#5) — July 23, 2011
Google+ — June 28, 2011
Panda 2.2 (#4) — June 21, 2011
Schema.org — June 2, 2011
Panda 2.1 (#3) — May 9, 2011
Panda 2.0 (#2) — April 11, 2011
The +1 Button — March 30, 2011
Panda/Farmer — February 23, 2011
Attribution Update — January 28, 2011
Overstock.com Penalty — January 1, 2011
Negative Reviews — December 1, 2010
Social Signals — December 1, 2010
Instant Previews — November 1, 2010
Google Instant — September 1, 2010
Brand Update — August 1, 2010
Caffeine (Rollout) — June 1, 2010
May Day — May 1, 2010
Google Places — April 1, 2010
Real-time Search — December 1, 2009
Caffeine (Preview) — August 1, 2009
Vince — February 1, 2009
Rel-canonical Tag — February 1, 2009
Google Suggest — August 1, 2008
Dewey — April 1, 2008
2007 Updates
Buffy — June 1, 2007
Universal Search — May 1, 2007
False Alarm — December 1, 2006
Supplemental Update — November 1, 2006
Big Daddy — December 1, 2005
Google Local/Maps — October 1, 2005
Jagger — October 1, 2005
Gilligan — September 1, 2005
XML Sitemaps — June 1, 2005
Personalized Search — June 1, 2005
Bourbon — May 1, 2005
Allegra — February 1, 2005
Nofollow — January 1, 2005
Google IPO — August 1, 2004
Brandy — February 1, 2004
Austin — January 1, 2004
Florida — November 1, 2003
Supplemental Index — September 1, 2003
Fritz — July 1, 2003
Esmeralda — June 1, 2003
Dominic — May 1, 2003
Cassandra — April 1, 2003
Boston — February 1, 2003
1st Documented Update — September 1, 2002
Google Toolbar — December 1, 2000
Source: moz.com
And remember
Generally speaking by adding annotations to your Google Analytics account you will be able to see more clearly if you have been affected by any Google updates.
Paul Lovell is an SEO Consultant And Founder at Always Evolving SEO. He can be found on Twitter @_PaulLovell.
Whitepapers
Related reading
Google never confirmed its existence, but many SEOs believe that Google Sandbox exists. So, does it exist in 2019? If yes, how to avoid getting affected?
While Google is an obvious “horse to bet on,” ubiquity, UX and utility will dominate the voice-search innovation race in 2020 and beyond.
Now, the free tool “automatically generates top competing sites that it uses as the basis for a more in-depth competitive analysis report,” Alexa.com President Andrew Ramm told SEW.
Walmart made headlines last week by announcing that it would fold Jet.com into its Walmart ecommerce operations. The story explained with two simple charts.