The COVID-19 pandemic has dramatically shifted consumer priorities and budgets, and now that local economies are beginning to reopen, we can expect to see more shifts as some people start to return to work and leisure activities. Understanding changes in consumer activity, sentiment and broader industry trends can help businesses continue to adjust.
Although regions may be lifting business and safety restrictions, consumers are going to reemerge at their own pace. The resources here can help you contextualize your performance and inform your content and messaging, campaign segmentation for targeting, as well as personalization and merchandising strategies.
General consumer trends
The following trend resources provide data across a range of industries. They can be used to get a glimpse of what consumers are prioritizing and how they’re responding as markets reopen.
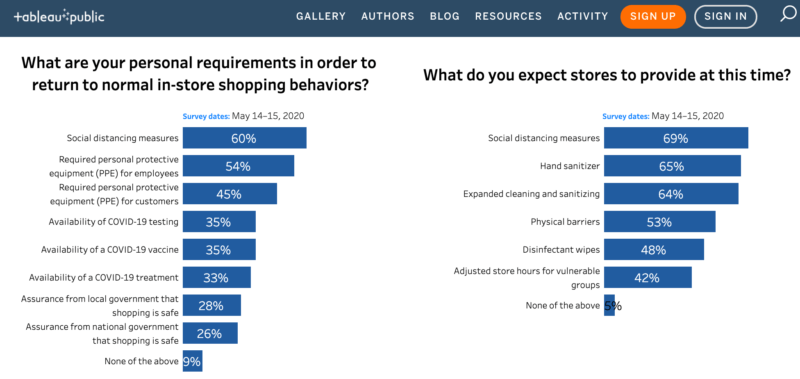
Tableau’s Snapshot Research Series. Data visualization company Tableau is collaborating with Salesforce Research to help marketers understand how consumers’ experiences and expectations are changing. Its Snapshot Research Series provides survey data bucketed into the following categories: Marketing, Commerce, Future of Work, Employee Experience, Sales, Customer Service and Small Business.
 Data from the Commerce section of Tableau’s Snapshot Research Series.
The data is updated every two weeks and can be filtered by country, generation, income and gender.
Google’s Rising Retail Categories. Unveiled in May, Google released this interactive tool to help retail and brand manufacturing partners monitor changes in search interest across a product categories. Rising Retail Categories also shows the regions where product category searches are growing and the queries associated with them.

Data is only available for Australia, Brazil, France, the UK and the U.S. at this time.
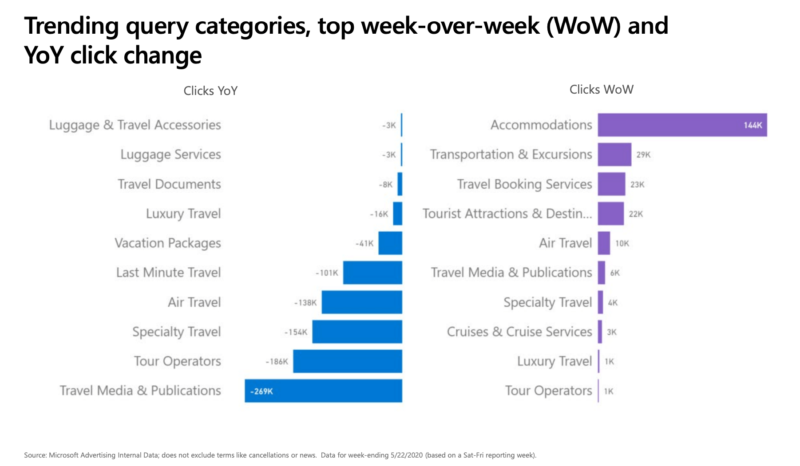
Microsoft’s COVID-19 insights and resources for advertisers. Microsoft Advertising regularly publishes free trends and insights reports for the automotive, financial services, health and wellness, retail and CPG, tech/teleconferencing and travel sectors.
 A chart from Microsoft Advertising’s travel update report.
The downloadable PDFs include data from Microsoft as well as external sources, YoY comparisons, and actionable insights such as top search days for Father’s Day, for example.
GlobalWebIndex. Market research SaaS company GlobalWebIndex provides subscribers with access to survey data from over 18 million customers in more than 40 countries, as well as brand perceptions for over 4,000 brands.

Its Audience Builder allows marketers to create target audiences based on needs, interests and demographic. The company also publishes trend, audience, and insight reports as well as infographics. These features are all paid, but you can also find timely, free insights in its Chart of the Week series.
Audience insights
The resources below will help you find out more about your own audience’s interests and the type of content they’re currently engaging with. You can use this information to create audience profiles or content that speaks to their needs.
SparkToro is an audience intelligence platform that crawls sites and social accounts, aggregating that data into profiles. Users can search its database by criteria such as what their target audience frequently talks about, the words they use in their profiles, the Twitter accounts they follow, the hashtags they use and the sites they visit.

The platform surfaces information on the social accounts, podcasts and YouTube channels your audience follows, the sites they visit and share, their geographic dispersion as well as common words and phrases used in their bios. SparkToro also provides generic estimates of your target audience size, its behavioral similarity and a margin of error, which it refers to as “Audience Confidence.” It’s a paid service, but there is a free trial available.
LinkedIn Content Suggestions. This tool lets LinkedIn Page admins discover articles and topics that their member community is engaging with. It’s meant to be a resource for sharing content, but it can also provide B2B companies with insights into what’s top-of-mind for their clients or customers.
Content suggestions can be filtered by industry, location, job function, seniority and audience size. As filters are selected, the suggested topics and articles change to reflect what that audience has been engaging with over the last 15 days. You can also add your own topics and check member engagement rates for each article.
PPC trends
Keeping an eye on your industry’s overall ad spend and metrics, such as average click-through rate and cost per click, can help contextualize your campaign performance and illustrate how advertisers and consumers are adjusting.
Tinuiti’s COVID-19 Trend Tracker. This tool shows changes in spend on Facebook campaigns over time and can be used to compare spend over two different periods across the agency’s client base.
It also has a tab for indexed spend trends, in which spend is shown relative to the first 11 days of March, just prior to the World Health Organization classifying the coronavirus as a pandemic. The Period over Period tab displays the actual numbers and percentage change across two time periods. The data covers 12 verticals and is updated daily.
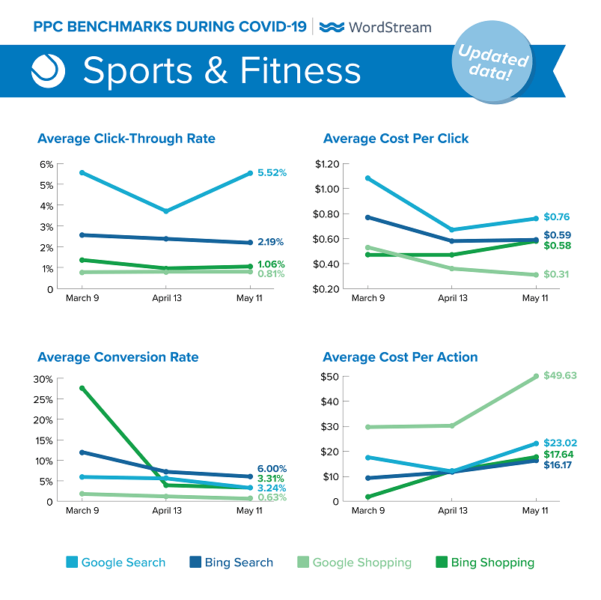
WordStream’s benchmark reports. Advertising software creator and consultancy WordStream publishes a PPC benchmark report about every other month.

The most recent report includes average click-through rates, cost per click, conversion rate and cost per action for ads across 21 industries on Google Search and Shopping as well as Bing Search and Shopping.
Have another great data resource for marketers during COVID? Let us know on Twitter by using the hashtag #SELProTip.
This story first appeared on Search Engine Land. For more on search marketing and SEO, click here.
https://searchengineland.com/data-roundup-resources-marketing-effectively-covid-335697


