Heads up, advertisers: Facebook is shrinking mobile News Feed ad space

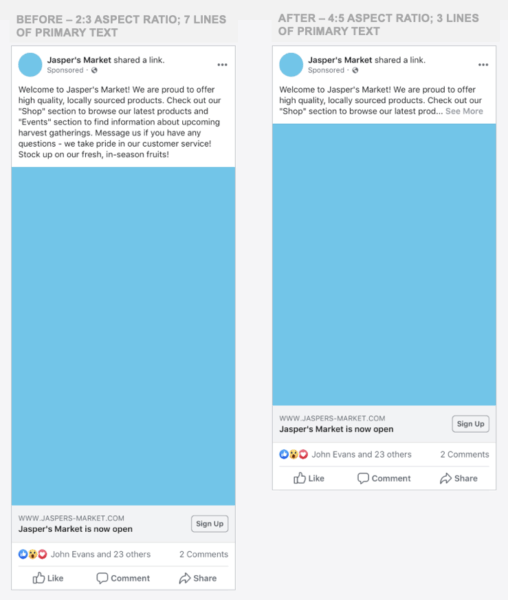
Facebook is making changes to the aspect ratio for posts and ads in its mobile News Feed. Beginning August 19, posts and ads in the mobile News Feed will display at a 4:5 aspect ratio, which means they’ll be shorter than at the original 2:3 aspect ratio.

For advertisers, this means ads will show fewer lines of text and the maximum height for photos or videos in the ad will be reduced to fit new design: “The tallest supported aspect ration for images without links and for videos is now vertical (4:5). Media taller than 4:5 will be masked on Facebook’s mobile News Feed.”

Why we should care

According to Facebook, the new ad layout will only allow for three lines of text, after which users will see a prompt to display more of the text. That’s a change from displaying as many as seven lines of text before the “See More” prompt. Ad copy will need to be tighter than ever to get your messages across — or entice users to click to “See More.”

Videos will also need to be optimized for the new size, otherwise they will be automatically “masked” when the changes take effect next month.

Susan Wenograd, VP of marketing strategy at Aimclear, was the first to note the coming changes on Twitter. She says, while its part of Facebook’s efforts to do some “housekeeping” by creating a more consistent mobile experience, the move points to the larger needs of social media marketing: that less has to be more.

“Less text, so it’s skimmable. Imagery that gets to the focal point quicker. These two things force marketers to synthesize their message into something instantly understandable,” said Wenograd, “It makes sense given the insane amount of content we are now seeing on a day-to-day basis.”

Wenograd believes that if an advertiser is going to interrupt a user’s primary reason for being on a platform, the message needs to be focused, concise and adaptable. She also noted the timing of Facebook’s announcement, coming at a time when brands are currently lamenting their declining direct-ROI from the platform.

“The slimming down of creative real estate furthers the need for marketers to be thinking in terms of the long game on their branding. They have less space to try and sell, so they need shorter messages delivered more frequently to cut through the noise,” said Wenograd.

More on the news


About The Author

Amy Gesenhues is a senior editor for Third Door Media, covering the latest news and updates for Marketing Land, Search Engine Land and MarTech Today. From 2009 to 2012, she was an award-winning syndicated columnist for a number of daily newspapers from New York to Texas. With more than ten years of marketing management experience, she has contributed to a variety of traditional and online publications, including MarketingProfs, SoftwareCEO, and Sales and Marketing Management Magazine. Read more of Amy’s articles.

mParticle’s new API could help marketers with “anonymous user” data

Customer data platform mParticle has released details around new APIs, platform features and identity aliasing that aims to deliver improved data accuracy and control. Included in the updates is a user aliasing API for managing and merging customer profiles, updates to the security of mParticle’s SDK, and a Google Tag Manager integration. 

Why we should care

Many marketers have been stumped by how to treat unknown user data for years. This new API could enable marketers to see the entire customer journey, which would provide key performance insights from bringing the “anonymous user” data into a customer profile for visibility into every touchpoint, end-to-end. 

In order to understand a full customer lifecycle, we need to also know how to treat “anonymous users” – like when the customer is logged out of your website. In order to manage that data, mParticle’s new user aliasing API  will allow users to automate the process of merging “anonymous users” data into customer profiles. Tying in the new data set could help marketers develop a more complete customer profile, inching them closer towards the 360 view.

More on the news:

  • New self hosting and bundler support was also launched for developers working in mParticle’s SDK.
  • mParticle also announced the release of its integration with Google Tag Manager, which will allow marketers more freedom when it comes to updating web tags and pixels and how to securely map the web data collected.

About The Author

Jennifer Videtta Cannon serves as Third Door Media’s Senior Editor, covering topics from email marketing and analytics to CRM and project management. With over a decade of organizational digital marketing experience, she has overseen digital marketing operations for NHL franchises and held roles at tech companies including Salesforce, advising enterprise marketers on maximizing their martech capabilities. Jennifer formerly organized the Inbound Marketing Summit and holds a certificate in Digital Marketing Analytics from MIT Sloan School of Management.

Don’t underestimate the power of video

Don’t underestimate the power of video

Video content impacts organic performance more than any other asset that can be displayed on a web page. In today’s online marketing world, videos have become an integral step in the user journey.

Yet for the large enterprises, video optimization is still not an essential part of their website optimization plan. Video content is still battling for recognition among the B2B marketer. Other industries, on the other hand, have already harnessed this power of video.

In the recent Google Marketing Live, Google mentioned that 80% of all online searches are followed by a video search. Some other stats to take into consideration,  according to Smallbiztrends by 2019, global consumer Internet video traffic will account for 80% of all consumer Internet traffic. Furthermore, pages with videos are 53 times more likely to rank on Google’s first page.

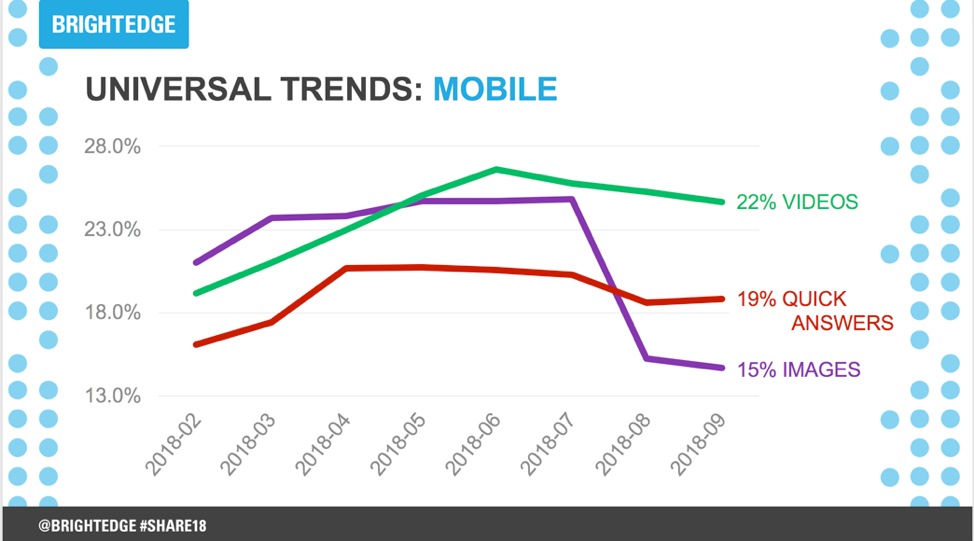
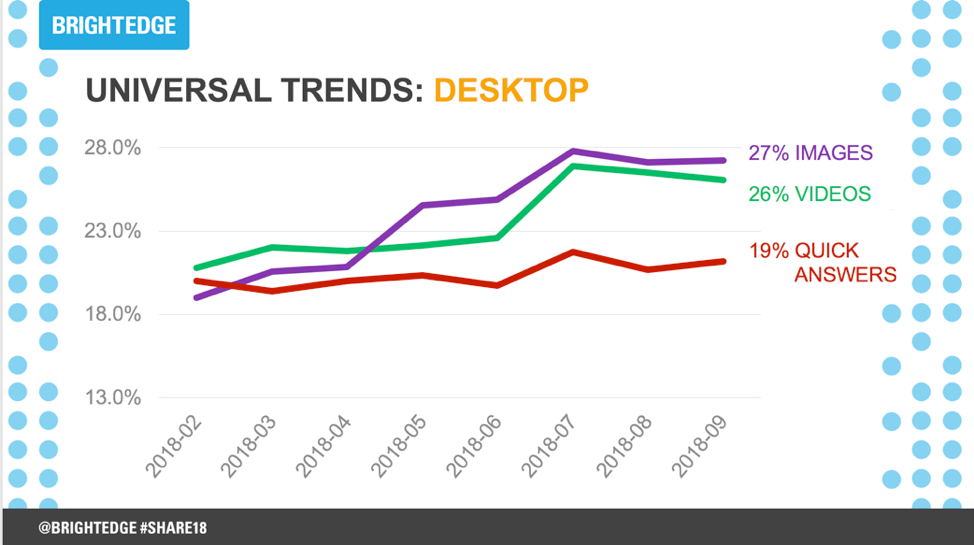
I took a deeper look into video content and its impact on organic performance. My analysis started in the fall of 2018. Google had already started to display video thumbnails in the SERPs. According to research from BrightEdge, Google is now showing video thumbnails in 26% of search results.

graph on video content and its impact on organic performance for mobiles

graph on video content and its impact on organic performance for desktops

Source: BrightEdge

Understanding the true influence of video SEO for your business will require some testing. I did four different sets of tests to arrive at the sweet spot for our pages.

The first test was to gauge if having video content on the page made any significant changes. I identified a page that ranked on page four of the SERP’s in spite of being well optimized. The team placed video content relevant to the textual content to the page. And the test result was loud and clear, having a video on the page increased relevance, resulting in increased rankings, and visibility in universal search. The Page started to rank on page one and the video thumbnail in the SERPs displayed the desired video and linked back to the page.

The next test was to understand the impact of the method of delivery. I measured what was the level of user engagement and organic performance when video contents are displayed/delivered on the page via different formats. The page was set up wherein users could get access to the video content either via a link that would take the user to YouTube or as a pop-up or as an embedded file that actually plays the video on the page itself. Results were very evident – every time the video was embedded on the page the user engagement increased, which decreased the bounce rate, and improved page ranking.

Taking a step further in our testing journey, I conducted a follow-up test to evaluate which category of video content performs better? Like any other SEO strategy, video optimization isn’t different. Skip the marketing fluff and go for product feature videos, “how-to” videos, or “what is” videos. We tested assorted video contents on the same page. Whenever the content of the video addressed a user need and was relevant to the page textual content the page rankings improved.

Lastly, I tested if Google prefers YouTube videos or domain hosted videos. On this subject, several of my business colleagues and I have budded heads. There is no universal truth. Google does display both YouTube and domain hosted videos in the thumbnails on the SERPs. Different sites will see different results. I tested the impacts of an embedded YouTube video on the page.  What I found was something I had not even considered in my hypothesis. When the video was already present on YouTube and then embedded on the page, the URL improved in rankings and at the same time the thumbnails on the SERPs showed the YouTube video but when the user clicked on the video it took them to the product page and not to the YouTube video.

Key takeaway

Many enterprise SEO strategists failed to leverage the video content because they feel their products are not that B2C in nature. Remember that search engines like videos because searchers like videos.

Videos take the static image or textual content to experience content, wherein the user can actually view how to use the information. This brings in a much higher and stronger level of engagement that in turn improving the brand reputation.

What video content should you consider?

I recommend starting at square one – what is the user intend/need you are trying to address. Define the goals you want to achieve from this video marketing. Are you looking to drive conversions or spread brand awareness? Put some thought into whether the video is informative and engaging and whether it is relevant to the page that it is displayed in.

Don’t overlook how that message is conveyed as well. Take into account personas as that establishes your intended target audience, the overall tone that the video should take. What stage of the user journey is being targeted? Understanding the areas where video results are high can help provide insight and guidance for additional content strategy ideas.

Things to remember when starting to incorporate video content

More and more people are searching and viewing content on their handheld devices. Therefore, you have to optimize this content with a mobile-first approach.

The basic SEO principle still applies. Optimize title, description, tags, transcript. Matching these to the user intent can encourage click-throughs

  • Ensure its page placement. Always surround your video with relevant content to tie it all together.
  • Videos up to two minutes long get the most engagement. Keep them short and let your brand shine through.

Don’t just link to it, embed it onto your site and make sure the video image is compelling.

This is the critical time to incorporate video content and optimization into your content strategy for 2019. When quality videos are added to web pages, it gets recognized as rich content, a step up from the regular text-filled pages. Video content will only help your optimization strategy in expanding your reach to driving engaged site visits.

Tanu Javeri is Senior Global SEO Strategist at IBM.

Whitepapers

Related reading

Why an SEO should lead your website migration

Search engine results: The ten year evolution

Ten ways to pump out a stream of great content without burning out

Six HTTP status codes most critical to your SEO success

Marketing salary survey 2019: Compensation trends in the U.S.

In our 2019 Marketing Technology and Operations Salary Survey, we broke down salary insights across the marketing landscape with the aim of building a benchmark reference for industry professionals.

Previously, we looked at marketing compensation through a global lens, examining how salaries stack up around the world. This time around, we explored marketing wages in the U.S. to highlight majority trends, identify key disparities, and direct attention to the roles that are shifting with the digital industry.

The majority of survey participants identified with one of the following types of marketing-related roles:

  • Digital Marketing / E-Commerce Marketing
  • Marketing Operations
  • Marketing Operations Technology (combined)
  • Marketing Technology / Marketing IT / Marketing Technologist
  • Service Provider / Consultant

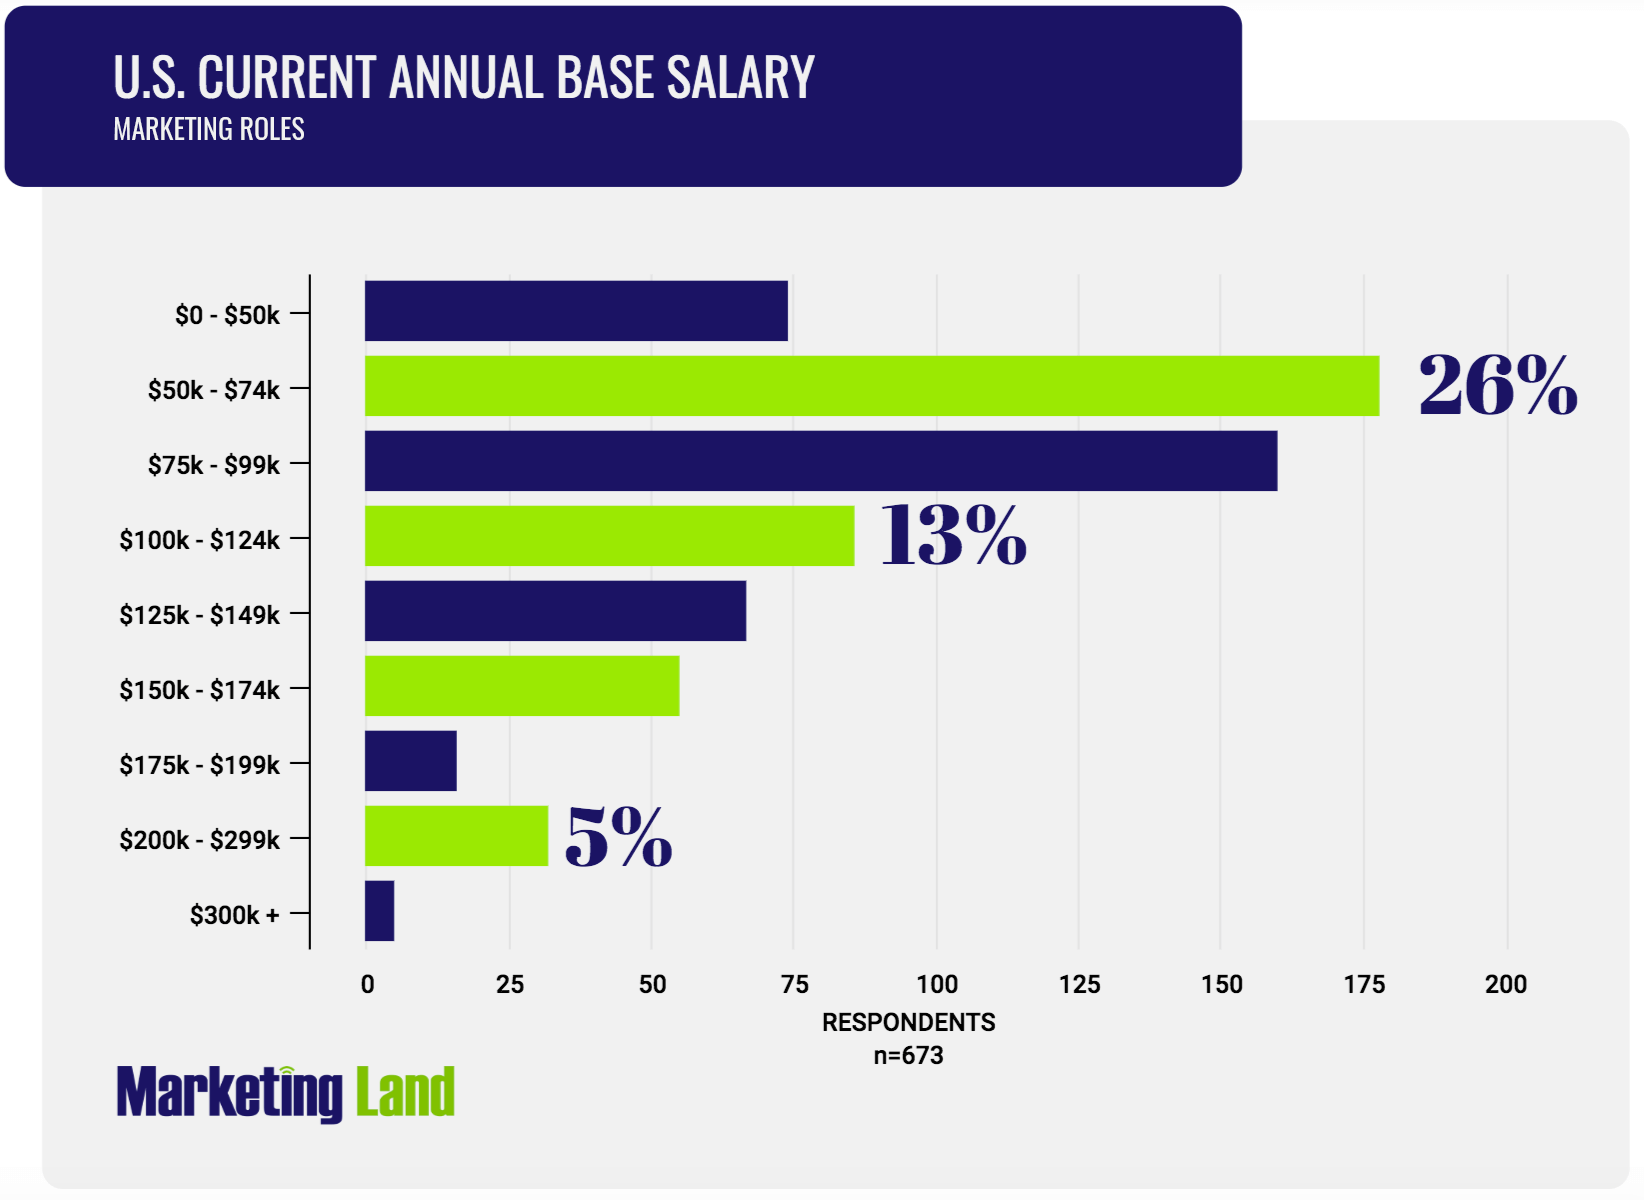
Of the sample of 673 survey respondents across the U.S., 26% reported earning a base salary between $50,000 – $74,000, excluding bonuses and additional compensation. Nearly a quarter of respondents (24%) reported a salary range of $75,000 – $99,000. Just 6% of respondents reported making more than $200,000 annually.

More than half (53%) or respondents said they work in digital marketing or e-commerce marketing roles – a 14% increase from last year’s survey findings. We expect the number to continue climbing as digital technology matures and roles expand.

Surprisingly, the 22% of respondents who selected their label as “Marketing Operations and Technology (combined)” fell by 7% from 2018, while the percentage of respondents who identified with the separate roles remained flat.

Among the 33% of respondents reporting 10+ years of experience in a marketing role, the salary distribution was divided fairly evenly among those who make between $50,000 – $99,000 and $100,000 – $149,000. A striking 11% make more than $200,000 annually, eclipsing the national income percentile by nearly 6%.

On a country-wide scale, it’s not surprising that California and New York represent the top earnings regions for marketing professionals, with 48% and 51% of respondents having reported a salary that exceeds $100,000, respectively.

In Washington alone, 57% of marketers surveyed earned more than $100,000 annually – a clear indication of the region’s (particularly, Seattle’s) prolificacy in marketing roles.

In our next round of salary survey analysis, we’ll dive into the divisive wage gaps that persist among demographic and gender disparities across the digital marketing industry.

Download our full 2019 Marketing Technology and Operations Salary Survey findings to see how your marketing income might stack up.


About The Author

Taylor Peterson is Third Door Media’s Deputy Editor, managing industry-leading coverage that informs and inspires marketers. Based in New York, Taylor brings marketing expertise grounded in creative production and agency advertising for global brands. Taylor’s editorial focus blends digital marketing and creative strategy with topics like campaign management, emerging formats, and display advertising.

How to set up Google Analytics annotations to show Google updates

set up google analytics annotations for google updates

With Google releasing more information of when updates take place, you should see it as a good practice to highlight this information in your Google Analytics account.

With the use of annotations, you will now have a visual guide in Google Analytic’s reports to help understand if you have been affected negatively or positively from the updates made to Google algorithm. But you can also use this to mark other important events for when changes have been applied to your website.
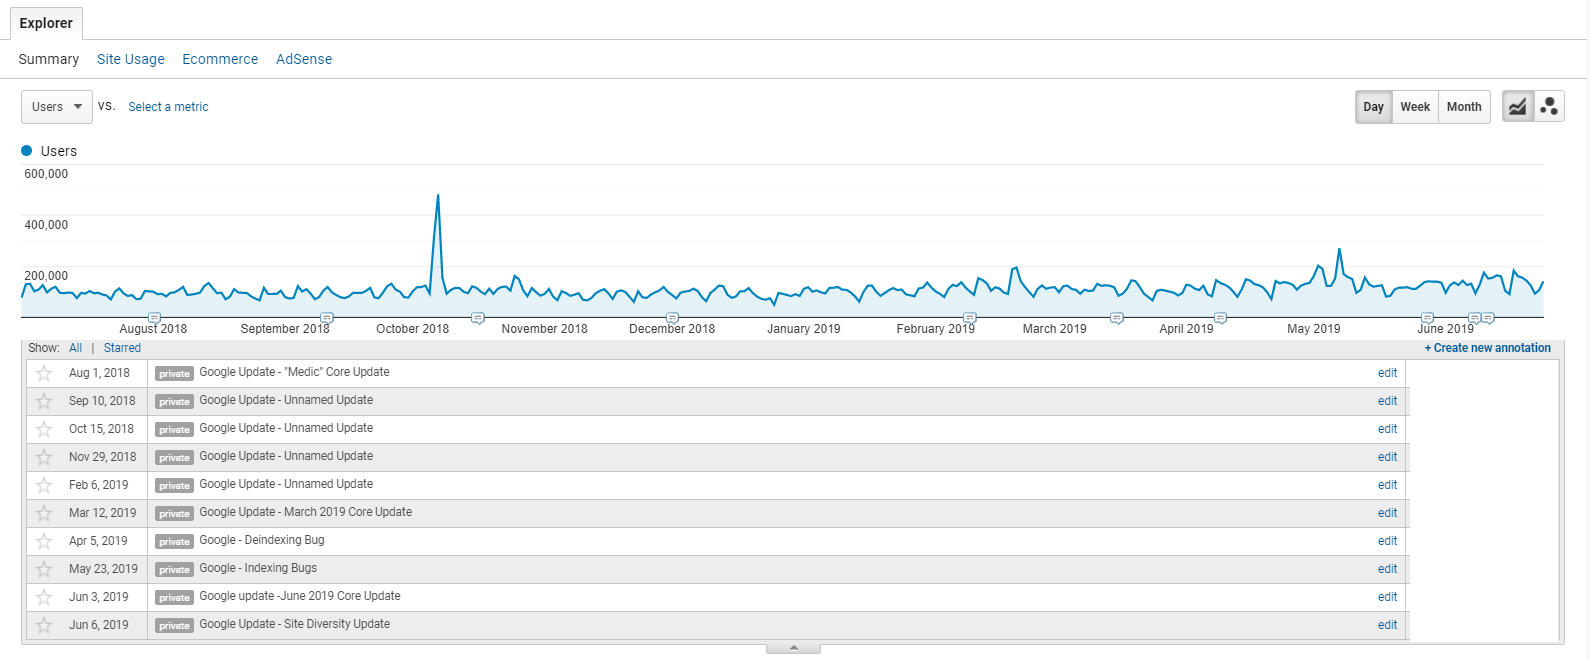
how to set up annotations in google analytics for google updates

Source: Google Analytics 

A four-step guide to creating an annotation

  1. Click on the small down arrow pointing triangle of any graph type of report.

set up annotations in google analytics

Source: Google Analytics

2) Click on the “+Create new annotation”.

create new annotation in google analytics

Source: Google Analytics

3) Complete the small form, select the date of the Google update and a small note that makes it clear what update/change took place.

4) And last but not least hit “Save”.

You can set your annotations to be private or shared (only if you have collaboration-level access the Google Analytics account can you select shared annotations).
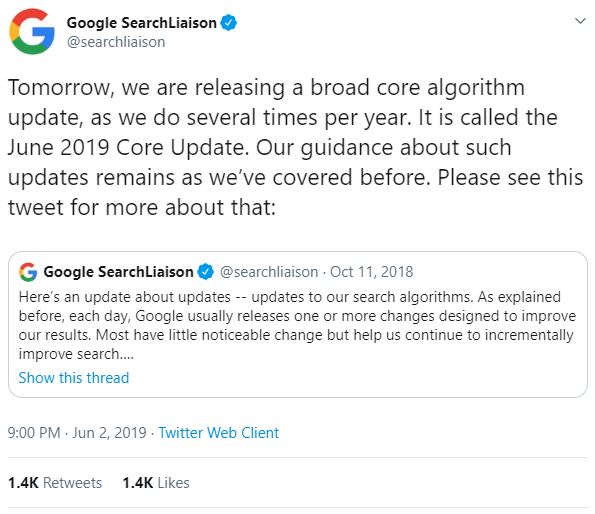
twitter announcement from google search liaison team about core update

Source: Twitter.com

When Google released the June core update in 2019, Google’s search liaison team pre-announced the update via Twitter, this is the first time they have ever done this. You can take advantage of this in the future by adding google annotations in advance so that you can see if there was a negative or positive effect on your organic traffic from google.

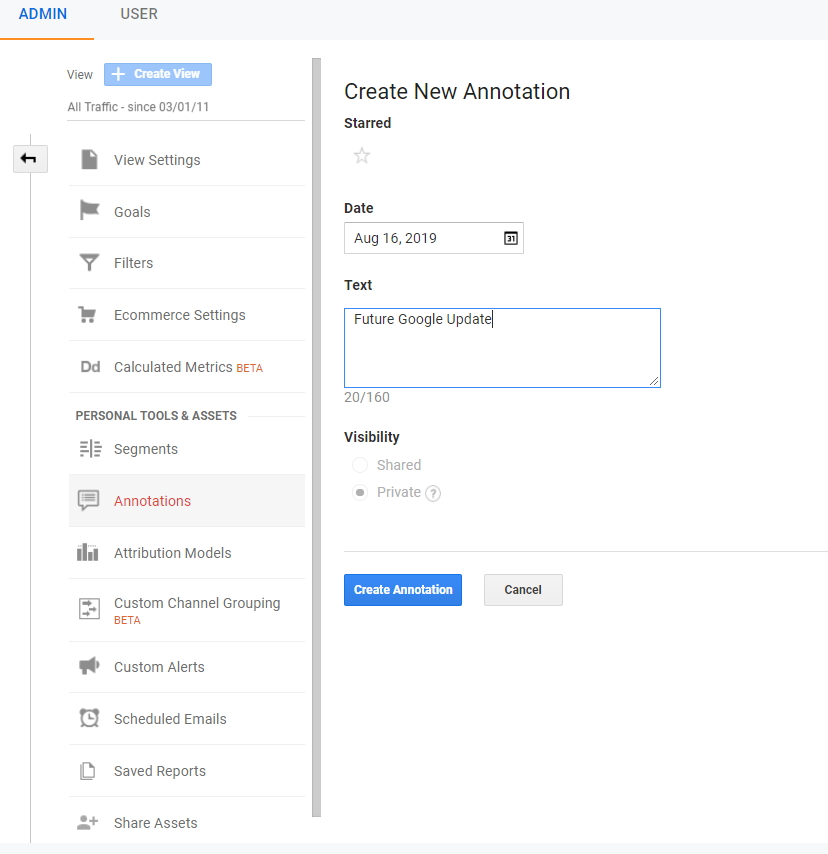
Having the ability to add annotations with a date set in the future can come in particularly handy if you know that there is an update about to go live from Google, or if your development team is about to upload their weekly change at 4.59 pm on a Friday.

How to add annotations for future Google updates

  1. Go to the admin section of your Google Analytics account
  2. Select the correct view in the far left-hand column
  3. Under “Personal tools & Assets”, select “Annotations”
  4. Click on “+ New Annotation” at the top of the table
  5. Enter the date of the Google update/change you will see that you are now able to select a date in the future
  6. Add some descriptive text about the change/update
  7. Chose the type of visibility – private or shared
  8. Click “Create Annotation”

set up google analytics annotation

Source: Google Analytics

List of Google updates to add Google Analytics annotations

Site Diversity Update  —  June 6, 2019

June 2019 Core Update  —  June 3, 2019

Indexing Bugs  —  May 23, 2019

Deindexing Bug  —  April 5, 2019

March 2019 Core Update  —  March 12, 2019

19-result SERPs  —  March 1, 2019

March 1st Google Search Algorithm Ranking Update – Unconfirmed (SER)

Unnamed Update  —  November 29, 2018

Unnamed Update  —  October 15, 2018

Unnamed Update  —  September 10, 2018

Medic Core Update  —  August 1, 2018

Chrome Security Warnings (Full Site)  —  July 24, 2018

Unnamed Update  —  July 21, 2018

Mobile Speed Update  —  July 9, 2018

Video Carousels  —  June 14, 2018

Unnamed Update  —  May 23, 2018

Snippet Length Drop  —  May 13, 2018

Unnamed Core Update  —  April 17, 2018

Mobile-First Index Roll-out  —  March 26, 2018

Zero-result SERP Test  —  March 14, 2018

Brackets Core Update  —  March 8, 2018

Unnamed Update  —  February 20, 2018

Maccabees Update  —  December 14, 2017

Snippet Length Increase  —  November 30, 2017

Unnamed Update  —  November 14, 2017

Featured Snippet Drop  —  October 27, 2017

Chrome Security Warnings (Forms)  —  October 17, 2017

Unnamed Update  —  September 27, 2017

Google Jobs  —  June 20, 2017

Unnamed Update  —  May 17, 2017

Google Tops 50% HTTPS  —  April 16, 2017

Fred (Unconfirmed)  —  March 8, 2017

Unnamed Update  —  February 6, 2017

Unnamed Update  —  February 1, 2017

Intrusive Interstitial Penalty  —  January 10, 2017

Unnamed Update  —  December 14, 2016

Unnamed Update  —  November 10, 2016

Penguin 4.0, Phase 2  —  October 6, 2016

Penguin 4.0, Phase 1  —  September 27, 2016

Penguin 4.0 Announcement  —  September 23, 2016

Image/Universal Drop  —  September 13, 2016

Possum  —  September 1, 2016

Mobile-friendly 2  —  May 12, 2016

Unnamed Update  —  May 10, 2016

AdWords Shake-up  —  February 23, 2016

Unnamed Update  —  January 8, 2016

RankBrain*  —  October 26, 2015

Panda 4.2 (#28)  —  July 17, 2015

The Quality Update  —  May 3, 2015

Mobile Update AKA “Mobilegeddon”  —  April 22, 2015

Unnamed Update  —  February 4, 2015

Pigeon Expands (UK, CA, AU)  —  December 22, 2014

Penguin Everflux  —  December 10, 2014

Pirate 2.0  —  October 21, 2014

Penguin 3.0  —  October 17, 2014

In The News Box  —  October 1, 2014

Panda 4.1 (#27)  —  September 23, 2014

Authorship Removed  —  August 28, 2014

HTTPS/SSL Update  —  August 6, 2014

Pigeon  —  July 24, 2014

Authorship Photo Drop  —  June 28, 2014

Payday Loan 3.0  —  June 12, 2014

Panda 4.0 (#26)  —  May 19, 2014

Payday Loan 2.0  —  May 16, 2014

Unnamed Update  —  March 24, 2014

Page Layout #3  —  February 6, 2014

Authorship Shake-up  —  December 19, 2013

Unnamed Update  —  December 17, 2013

Unnamed Update  —  November 14, 2013

Penguin 2.1 (#5)  —  October 4, 2013

Hummingbird  —  August 20, 2013

In-depth Articles  —  August 6, 2013

Unnamed Update  —  July 26, 2013

Knowledge Graph Expansion  —  July 19, 2013

Panda Recovery  —  July 18, 2013

Multi-Week Update  —  June 27, 2013

Panda Dance  —  June 11, 2013

Penguin 2.0 (#4)  —  May 22, 2013

Domain Crowding  —  May 21, 2013

Phantom  —  May 9, 2013

Panda #25  —  March 14, 2013

Panda #24  —  January 22, 2013

Panda #23  —  December 21, 2012

Knowledge Graph Expansion  —  December 4, 2012

Panda #22  —  November 21, 2012

Panda #21  —  November 5, 2012

Page Layout #2  —  October 9, 2012

Penguin #3  —  October 5, 2012

August/September 65-Pack  —  October 4, 2012

Panda #20  —  September 27, 2012

Exact-Match Domain (EMD) Update  —  September 27, 2012

Panda 3.9.2 (#19)  —  September 18, 2012

Panda 3.9.1 (#18)  —  August 20, 2012

7-Result SERPs  —  August 14, 2012

June/July 86-Pack  —  August 10, 2012

DMCA Penalty (“Pirate”)  —  August 10, 2012

Panda 3.9 (#17)  —  July 24, 2012

Link Warnings  —  July 19, 2012

Panda 3.8 (#16)  —  June 25, 2012

Panda 3.7 (#15)  —  June 8, 2012

May 39-Pack  —  June 7, 2012

Penguin 1.1 (#2)  —  May 25, 2012

Knowledge Graph  —  May 16, 2012

April 52-Pack  —  May 4, 2012

Panda 3.6 (#14)  —  April 27, 2012

Penguin  —  April 24, 2012

Panda 3.5 (#13)  —  April 19, 2012

Parked Domain Bug  —  April 16, 2012

March 50-Pack  —  April 3, 2012

Panda 3.4 (#12)  —  March 23, 2012

Search Quality Video  —  March 12, 2012

Venice  —  February 27, 2012

February 40-Pack (2)  —  February 27, 2012

Panda 3.3 (#11)  —  February 27, 2012

February 17-Pack  —  February 3, 2012

Ads Above The Fold  —  January 19, 2012

Panda 3.2 (#10)  —  January 18, 2012

Search + Your World  —  January 10, 2012

January 30-Pack  —  January 5, 2012

December 10-Pack  —  December 1, 2011

Panda 3.1 (#9)  —  November 18, 2011

10-Pack of Updates  —  November 14, 2011

Freshness Update  —  November 3, 2011

Query Encryption  —  October 18, 2011

Panda “Flux” (#8)  —  October 5, 2011

“Minor” Google Panda Update On November 18th (SEL)

Panda 2.5 (#7)  —  September 28, 2011

516 Algo Updates  —  September 21, 2011

Pagination Elements  —  September 15, 2011

Expanded Sitelinks  —  August 16, 2011

Panda 2.4 (#6)  —  August 12, 2011

Panda 2.3 (#5)  —  July 23, 2011

Google+  —  June 28, 2011

Panda 2.2 (#4)  —  June 21, 2011

Schema.org  —  June 2, 2011

Panda 2.1 (#3)  —  May 9, 2011

Panda 2.0 (#2)  —  April 11, 2011

The +1 Button  —  March 30, 2011

Panda/Farmer  —  February 23, 2011

Attribution Update  —  January 28, 2011

Overstock.com Penalty  —  January 1, 2011

Negative Reviews  —  December 1, 2010

Social Signals  —  December 1, 2010

Instant Previews  —  November 1, 2010

Google Instant  —  September 1, 2010

Brand Update  —  August 1, 2010

Caffeine (Rollout)  —  June 1, 2010

May Day  —  May 1, 2010

Google Places  —  April 1, 2010

Real-time Search  —  December 1, 2009

Caffeine (Preview)  —  August 1, 2009

Vince  —  February 1, 2009

Rel-canonical Tag  —  February 1, 2009

Google Suggest  —  August 1, 2008

Dewey  —  April 1, 2008

2007 Updates

Buffy  —  June 1, 2007

Universal Search  —  May 1, 2007

False Alarm  —  December 1, 2006

Supplemental Update  —  November 1, 2006

Big Daddy  —  December 1, 2005

Google Local/Maps  —  October 1, 2005

Jagger  —  October 1, 2005

Gilligan  —  September 1, 2005

XML Sitemaps  —  June 1, 2005

Personalized Search  —  June 1, 2005

Bourbon  —  May 1, 2005

Allegra  —  February 1, 2005

Nofollow  —  January 1, 2005

Google IPO  —  August 1, 2004

Brandy  —  February 1, 2004

Austin  —  January 1, 2004

Florida  —  November 1, 2003

Supplemental Index  —  September 1, 2003

Fritz  —  July 1, 2003

Esmeralda  —  June 1, 2003

Dominic  —  May 1, 2003

Cassandra  —  April 1, 2003

Boston  —  February 1, 2003

1st Documented Update  —  September 1, 2002

Google Toolbar  —  December 1, 2000

Source: moz.com

And remember

Generally speaking by adding annotations to your Google Analytics account you will be able to see more clearly if you have been affected by any Google updates.

Paul Lovell is an SEO Consultant And Founder at Always Evolving SEO. He can be found on Twitter @_PaulLovell.

Whitepapers

Related reading

Google Sandbox Is it still affecting new sites in 2019

alexa.com search tools updates competitive analysis

Decommissioning Jet Two charts proving Walmart planned to ground Jet all along

4 steps to becoming an experience brand

Once a primary differentiator, reliable customer service has now become a mandatory commodity. With rising consumer expectations and automated technologies, experience has replaced this long-heralded advantage.

Brands positioned with a customer-first, always-on experience optimization approach and those who build for personalization are poised to be market leaders. Becoming an experience-focus brand has been painted as more difficult than it is. The answers and truth are right in front of us. Your consumers have those answers, you just need to ask – and pay attention.

In working with more than 30 brands on their experience strategies, I’ve found four critical steps to helping brands successfully migrate to become customer experience leaders in their market. The simple formula is to identify, measure, build and test.

Identify audiences and journeys

Identify your audience

Let’s start with an exercise. Suppose money is no object, and you get to pick out a new vehicle. Take a moment to picture what you’d like to buy. Now that you have that vehicle in mind, let’s assume that this is the vehicle everyone else wants. It seems ridiculous that the vehicle you want is assumed to be the vehicle everyone else would want. But, how often do you create experiences using that same assumption? As you design an experience, you need to have an audience in mind, but oftentimes, experiences are developed in a vacuum without consumer feedback. In our current environment audience strategy and experiences should never be developed without some type of consumer insight.

Here are a few questions to help you get started in assessing your audience(s).

  • Who is my current audience? 
  • What data sources do I have available to me (research, analytics, databases, etc.)? 
  • What do they prefer? What are their motivations? 
  • Who is/not responding?  
  • Do my loyal customers look different than everyone else? What type of data and insights am I missing? 

Identify audience journeys

I often think of the journey as the foundation. The good news about building out an audience journey is that there are a lot of good approaches. I do not believe there is one single source of truth to creating an audience journey. The important thing is that you create one. If your budget, resources, and time only allow for a whiteboard brainstorm session, then do it. If you have behavioral data at your fingertips and can look at connected event stream data by specific channels and by individual, then do it. If you have the ability to conduct primary research, please do it.

After building a journey, the first mistake I see is that too many brands try to tackle fixing all of the possible interactions they’ve discovered. Prioritization becomes key; if you are able to gather consumer-driven insights to measure and help you prioritize experiences, then that should be your next step.

How do they behave? How do they buy? What are the most common paths to purchase? What are all of the possible interactions?

Measure experiences

Beginning to think from the consumer’s perspective is the right first step, but it is far more effective to actually measure experiences from their direct interactions. Always-on customer-listening engines have been around for decades. Today’s new wave of measurement is more effective but needs to be further elevated. The Customer Effort Score (CES) has come to the forefront of this movement but is lacking in three critical components: measuring multiple interactions, measuring importance, and measuring revenue. But the four-dimensional approach has the power to begin moving the needle.

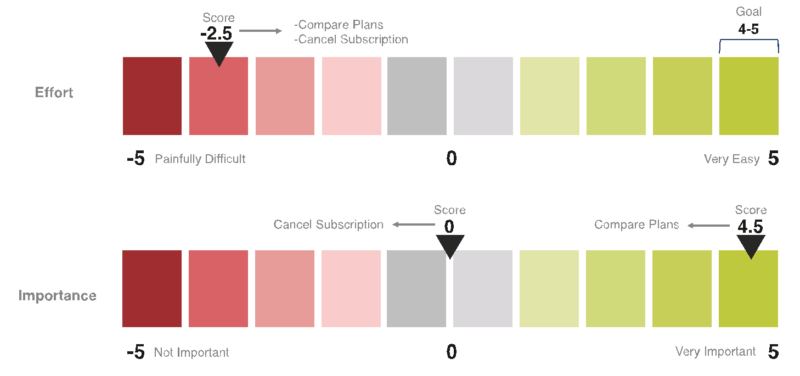
The measurement of ease to work with a brand across interactions, prioritized within the journey, allows brands to identify the most critical points within the consumer experience. This enables brands to find quick wins to remove as much friction as possible. In the example provided in the image above, one would initially think that “compare plans” and “cancel subscription” should be the areas of focus, but a closer look at importance guides you to prioritize “compare plans” to have the greatest impact.

What are their significant phases of interaction in their journey? Which interactions are the most important? What interactions are in desperate need of help? What is the revenue associated with each interaction?

Build

With a foundational and an architectural assessment, you’ll be poised to build best-in class experiences based on consumer insights. Along the way, an audit of data and technology will become critical to supporting the automation of personalized, people-based experiences. The alignment of key stakeholders across the organization will be another critical component to driving change, which is why a data-driven approach to prioritization from the consumer’s perspective is needed for the potential political battles you’ll be up against.

Another supporting point for your internal journey will be the results from prioritized quick wins. A four-dimensional prioritization of experiences allows the brand to hit the ground running, making immediate improvements to prove out the work, while also laying out critical interactions that may take more significant efforts to improve for long-term planning.

Who are the key stakeholders (detractors/supporters)? What quick wins are we going to tackle? What is our long-term experience roadmap? What technologies/data do I need? 

Test experiences

Another shift in the market over the years has continued in the same vein of always-on, quick-win optimization. Take, for example, website redesigns, as depicted in the image above. Traditional methods would call for significant redesigns every couple of years, requiring weighty amounts of time and money, with gaps and subpar experiences in between. There is a better way. If you are truly interested in meeting consumer expectations you’ll not only be measuring and tracking those experiences on an ongoing basis, but you’ll be consistently making updates to improve them.

What approach are we using today? What tools do I need to conduct testing? What should we test first? Who (internal and/or consumers) should I gather feedback from?

I believe Dentsu Aegis Network Americas CEO Nick Brien sums it up best when he says, “There’s been a fundamental shift in the balance of power. When I started in marketing, I lived in a brand-led world – you changed consumer behavior. But now we live in a consumer-led world. It’s about changing your brand behavior, it is about personalization, it is about relevance, it is about engagement.”


Opinions expressed in this article are those of the guest author and not necessarily Marketing Land. Staff authors are listed here.


About The Author

Strategic brand and direct marketer, leading a team of experience and research strategists in using cognitive psychology and advanced analytics to develop insight-driven strategy with 30-plus brands such as Samsung, GM, SoFi, Lowe’s, MetLife, Dell, Boys & Girls Club and Regions Bank. Personally recognized by the ANA, MediaPost and the Drum Marketing with thought leadership on the subject of neuroanalytics in the Huffington Post, Bank Administration Institute and the Philanthropy Journal.

Research: The most common SEO errors

Research The most common SEO errors

Now, after reading the title, you can think, “What new can I read here? At least every month I see similar articles on different blogs”. I can say without a doubt you’ll definitely like this post.

My article is developed on the basis of unique research.

Every SEO specialist checks a site with the help of some SEO service. I work at one of the most popular all-in-one SEO platforms — Serpstat. Every year our team analyzes site audit results of our users to find out which SEO errors are really the most common.

In this article, I’ll shed light on the results we’ve got for the last year.

Serpstat research: Results we’ve got

During 2018, our users carried out 204K audits and checked 223M pages through Serpstat. Our team analyzed this data and collected the stat.

All stat you can see on the infographics below the text. I just want to specify some facts in words here.

After the research, we’ve discovered that most sites had problems with meta tags, markups, and links. The most common errors are concerned with headlines, HTTPS certificate, and redirects. Issues with hreflang, multimedia, content, indexing, HTTP status codes, AMP (accelerated mobile pages), and loading time were least likely.

Also, we’ve analyzed country-specific domains to get more exact information. The stat we’ve got from it shows that 70% of “.com” domains have the most common problems with links, loading time, and indexing. The same situation is with “.uk” and “.ca” domains.

The most common mistakes and how to fix them

1. Meta tags

Meta tags are rather important despite the fact they aren’t visible to website users. They tell search engines what the page is about and take part in snippets creation. Meta tags affect your website ranking. Errors which can occur with them may spoil user signals.

According to our research, you should first check the length of the title and description itself.

2. Links, markups, and headings

External links (their number and quality) affect your site’s position in SERP as search engines rate link profiles very carefully. Also, you should always remember about internal links factors (nofollow attributes and URL optimization).

The Serpstat team also found out that bugs with markups and headings are rather popular ones despite the fact that they are very important for websites. Markups and headings contain attributes which mark and structure the data of the page. They also help search engines and networks crawl and display the site correctly.

The most common errors in this chapter are with:

  • Nofollow external link attributes
  • Missing Twitter card markups
  • H1 doubling the title tag

3. HTTPS certificate

This certificate is one of the important ranking factors as it ensures a secure connection to the website and the browser. If your website uses personal information, don’t forget to pay attention to it.

The most common mistake here is the referral of HTTPS website to HTTP one.

4. Redirects, hreflang attribute, multimedia

Redirects direct users from the requested URL to another one you need. According to our statistics, you should avoid the most common error with them — having a multilingual interface it’s necessary to apply the hreflang attribute for the same content in different languages. In such a way search engines can understand which version of your texts users prefer.

Multimedia elements don’t affect SEO directly. Although, they can cause bad user signals and indexing errors. Also, pictures affect the website’s loading time. That’s why multimedia are rather important. And here is the same situation with the hreflang attribute — if you have the multilingual interface, you should apply it for the same content in multiple languages.

More info about errors in this section you can find on the infographics.

5. Indexing

Search engines find out what sites are about while indexing. If the site is closed for indexing, users can’t find it in the SERP. Some weak spots of the site that often lead to errors are the following:

  • Canonical tags that reference a different page
  • Non-indexed pages (noindex)
  • iframe tags

6. HTTP status codes, AMP, and content

Answers that the server delivers on user request have the name HTTP status codes. Errors with them are rather serious problems and negatively affect the position of the site in SERPs.

AMP is accelerated pages optimized for mobile devices. You should use such technologies to improve the loading time of the site. Also, poor content causes the deterioration of ranking positions.

The most common problems here are:

  • 404 error codes
  • missing AMP
  • generated content

7. Loading time

Long loading time can worsen the site’s usability and waste the crawling budget. Serpstat team found that the most common problems with this issue are associated with the use of browser cache, image, JavaScript, and CSS optimization.

You can view the detailed infographic here.

How to correct these errors

To find all the above-mentioned errors for your own site, you can start a custom project at Serpstat Audit tool. Here you can check the whole site or even just a separate page. The module checks 20 pages per second and finds more than 50 errors that potentially harm your site.

In its reports, Serpstat sorts errors by importance and categories and gives the list of pages on which these problems were found. In addition, it offers recommendations on how to resolve a specific problem. Some of them are not errors in the true sense (“Information”), they are only shown for you to be aware of such problems.

Summary

There are a lot of errors that can damage your site and its rankings. Despite this fact, you can find them all at once with the help of audit tools.

At first, pay your attention to the most common weaknesses:

  • Meta tags
  • Markups
  • Links
  • Headings
  • HTTPS certificate
  • Redirects
  • Hreflang attribute
  • Multimedia
  • Indexing
  • HTTP status сodes
  • AMP
  • Loading time
  • Content

Inna Yatsyna is a Brand and Community Development Specialist at Serpstat. She can be found on Twitter .

Related reading

Search engine results: The ten year evolution

Six HTTP status codes most critical to your SEO success

Seven time-tested tactics to generate more Google reviews

Three tools providing actionable competitive research insight

20190718 ML Brief

Good morning, is your business using chatbots to communicate with customers?

According to new research from Drift and SurveyMonkey Audience, chatbots are catching up to email and phone as a key part of the conversational marketing mix. Email and telephone still dominate as the top channels for communication, but 33% of respondents reported having used online chat within the last 12 months – an indication that chat is gaining ground.

Almost half the consumers surveyed (44%) said they expect an interaction within five seconds when engaging with a brand face-to-face. On the digital side, 42% of respondents indicated they expect the same interaction time when communicating with a chatbot. The data surfaces a consumer insight that isn’t all too surprising: instant communication is a top priority for online shoppers wanting a quick and convenient way to solve customer issues.

So what does it mean for marketers? Investing more in one-to-one customer experiences (like chatbots or customer service chat) can be the key differentiator for positive interactions between brands and customers. Businesses that have been hesitant to integrate chat will find themselves playing catch-up when it comes time to implement the technology to meet the growing demands of consumers. 

There’s more to read below, including why running multi-channel campaigns can result in more favorable outcomes, and more. 

Taylor Peterson,
Deputy Editor

Delete your pages and rank higher in search – Index bloat and technical optimization 2019

Delete your pages and rank higher in search - Index bloat and technical optimization 2019

If you’re looking for a way to optimize your site for technical SEO and rank better, consider deleting your pages.

I know, crazy, right? But hear me out.

We all know Google can be slow to index content, especially on new websites. But occasionally, it can aggressively index anything and everything it can get its robot hands on whether you want it or not. This can cause terrible headaches, hours of clean up, and subsequent maintenance, especially on large sites and/or ecommerce sites.

Our job as search engine optimization experts is to make sure Google and other search engines can first find our content so that they can then understand it, index it, and rank it appropriately. When we have an excess of indexed pages, we are not being clear with how we want search engines to treat our pages. As a result, they take whatever action they deem best which sometimes translates to indexing more pages than needed.

Before you know it, you’re dealing with index bloat.

What is the index bloat?

Put simply, index bloat is when you have too many low-quality pages on your site indexed in search engines. Similar to bloating in the human digestive system (disclaimer: I’m not a  doctor), the result of processing this excess content can be seen in search engines indices when their information retrieval process becomes less efficient.

Index bloat can even make your life difficult without you knowing it. In this puffy and uncomfortable situation, Google has to go through much more content than necessary (most of the times low-quality and internal duplicate content) before they can get to the pages you want them to index.

Think of it this way: Google visits your XML sitemap to find 5,000 pages, then crawls all your pages and finds even more of them via internal linking, and ultimately decides to index 30,000 URLs. This comes out to an indexation excess of approximately 500% or even more.

But don’t worry, diagnosing your indexation rate to measure against index bloat can be a very simple and straight forward check. You simply need to cross-reference which pages you want to get indexed versus the ones that Google is indexing (more on this later).

The objective is to find that disparity and take the most appropriate action. We have two options:

  1. Content is of good quality = Keep indexability
  2. Content is of low quality (thin, duplicate, or paginated) = noindex

You will find that most of the time, index bloat results in removing a relatively large number of pages from the index by adding a “NOINDEX” meta tag. However, through this indexation analysis, it is also possible to find pages that were missed during the creation of your XML sitemap(s), and they can then be added to your sitemap(s) for better indexing.

Why index bloat is detrimental for SEO

Index bloat can slow processing time, consume more resources, and open up avenues outside of your control in which search engines can get stuck. One of the objectives of SEO is to remove roadblocks that hinder great content from ranking in search engines, which are very often technical in nature. For example, slow load speeds, using noindex or nofollow meta tags where you shouldn’t, not having proper internal linking strategies in place, and other such implementations.

Ideally, you would have a 100% indexation rate. Meaning every quality page on your site would be indexed – no pollution, no unwanted material, no bloating. But for the sake of this analysis, let’s consider anything above 100% bloat. Index bloat forces search engines to spend more resources (which are limited) than needed processing the pages they have in their database.

At best, index bloat causes inefficient crawling and indexing, hindering your ranking capability. But index bloat at worst can lead to keyword cannibalization across many pages on your site, limiting your ability to rank in top positions, and potentially impacting the user experience by sending searchers to low-quality pages.

To summarize, index bloat causes the following issues:

  1. Exhausts the limited resources Google allocates for a given site
  2. Creates orphaned content (sending Googlebot to dead-ends)
  3. Negatively impacts the website’s ranking capability
  4. Decreases the quality evaluation of the domain in the eyes of search engines

Sources of index bloat

1. Internal duplicate content

Unintentional duplicate content is one of the most common sources of index bloat. This is because most sources of internal duplicate content revolve around technical errors that generate large numbers of URL combinations that end up indexed. For example, using URL parameters to control the content on your site without proper canonicalization.

Faceted navigation has also been one of the “thorniest SEO challenges” for large ecommerce sites, as Portent describes, and has the potential of generating billions of duplicate content pages by overlooking a simple feature.

2. Thin content

It’s important to mention an issue introduced by the Yoast SEO plugin version 7.0 around attachment pages. This WordPress plugin bug led to “Panda-like problems” in March of 2018 causing heavy ranking drops for affected sites as Google deemed these sites to be lower in the overall quality they provided to searchers. In summary, there is a setting within the Yoast plugin to remove attachment pages in WordPress – a page created to include each image in your library with minimal content – the epitome of thin content for most sites. For some users, updating to the newest version (7.0 then) caused the plugin to overwrite the previous selection to remove these pages and defaulted to index all attachment pages.

This then meant that having five images per blog post would lead to 5x-ing the number of indexed pages with 16% of actual quality content per URL, causing a massive drop in domain value.

3. Pagination

Pagination refers to the concept of splitting up content into a series of pages to make content more accessible and improve user experience. This means that if you have 30 blog posts on your site, you may have ten blog posts per page that go three pages deep. Like so:

  • https://www.example.com/blog/
  • https://www.example.com/blog/page/2/
  • https://www.example.com/blog/page/3/

You’ll see this often on shopping pages, press releases, and news sites, among others.

Within the purview of SEO, the pages beyond the first in the series will very often contain the same page title and meta description, along with very similar (near duplicate) body content, introducing keyword cannibalization to the mix. Additionally, the purpose of these pages is for a better browsing user experience for users already on your site, it doesn’t make sense to send search engine visitors to the third page of your blog.

4. Under-performing content

If you have content on your site that is not generating traffic, has not resulted in any conversions, and does not have any backlinks, you may want to consider changing your strategy. Repurposing content is a great way to maximize any value that can be salvaged from under-performing pages to create stronger and more authoritative pages.

Remember, as SEO experts our job is to help increase the overall quality and value that a domain provides, and improving content is one of the best ways to do so. For this, you will need a content audit to evaluate your own individual situation and what the best course of action would be.

Even a 404 page that results in a 200 Live HTTP status code is a thin and low-quality page that should not be indexed.

Common index bloat issues

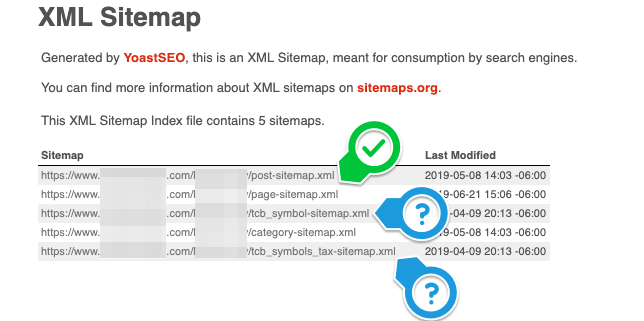
One of the first things I do when auditing a site is to pull up their XML sitemap. If they’re on a WordPress site using a plugin like Yoast SEO or All in One SEO, you can very quickly find page types that do not need to be indexed. Check for the following:

  • Custom post types
  • Testimonial pages
  • Case study pages
  • Team pages
  • Author pages
  • Blog category pages
  • Blog tag pages
  • Thank you pages
  • Test pages

To determine if the pages in your XML sitemap are low-quality and need to be removed from search really depends on the purpose they serve on your site. For instance, sites do not use author pages in their blog, but still, have the author pages live, and this is not necessary. “Thank you” pages should not be indexed at all as it can cause conversion tracking anomalies. Test pages usually mean there’s a duplicate somewhere else. Similarly, some plugins or developers build custom features on web builds and create lots of pages that do not need to be indexed. For example, if you find an XML sitemap like the one below, it probably doesn’t need to be indexed:

  • https://www.example.com/tcb_symbols_tax-sitemap.xml

Different methods to diagnose index bloat

Remember that our objective here is to find the greatest contributors of low-quality pages that are bloating the index with low-quality content. Most times it’s very easy to find these pages on a large scale since a lot of thin content pages follow a pattern.

This is a quantitative analysis of your content, looking for volume discrepancies based on the number of pages you have, the number of pages you are linking to, and the number of pages Google is indexing. Any disparity between these numbers means there’s room for technical optimization, which often results in an increase in organic rankings once solved. You want to make these sets of numbers as similar as possible.

As you go through the various methods to diagnose index bloat below, look out for patterns in URLs by reviewing the following:

  • URLs that have /dev/
  • URLs that have “test”
  • Subdomains that should not be indexed
  • Subdirectories that should not be indexed
  • A large number of PDF files that should not be indexed

Next, I will walk you through a few simple steps you can take on your own using some of the most basic tools available for SEO. Here are the tools you will need:

  • Paid Screaming Frog
  • Verified Google Search Console
  • Your website’s XML sitemap
  • Editor access to your Content Management System (CMS)
  • Google.com

As you start finding anomalies, start adding them to a spreadsheet so they can be manually reviewed for quality.

1. Screaming Frog crawl

Under Configuration > Spider > Basics, configure Screaming Frog to crawl (check “crawl all subdomains”, and “crawl outside of start folder”, manually add your XML sitemap(s) if you have them) for your site in order to run a thorough scan of your site pages. Once the crawl has been completed, take note of all the indexable pages it has listed. You can find this in the “Self-Referencing” report under the Canonicals tab.

screenshot example of using Screaming Frog to scan through XML sitemaps

Take a look at the number you see. Are you surprised? Do you have more or fewer pages than you thought? Make a note of the number. We’ll come back to this.

2. Google’s Search Console

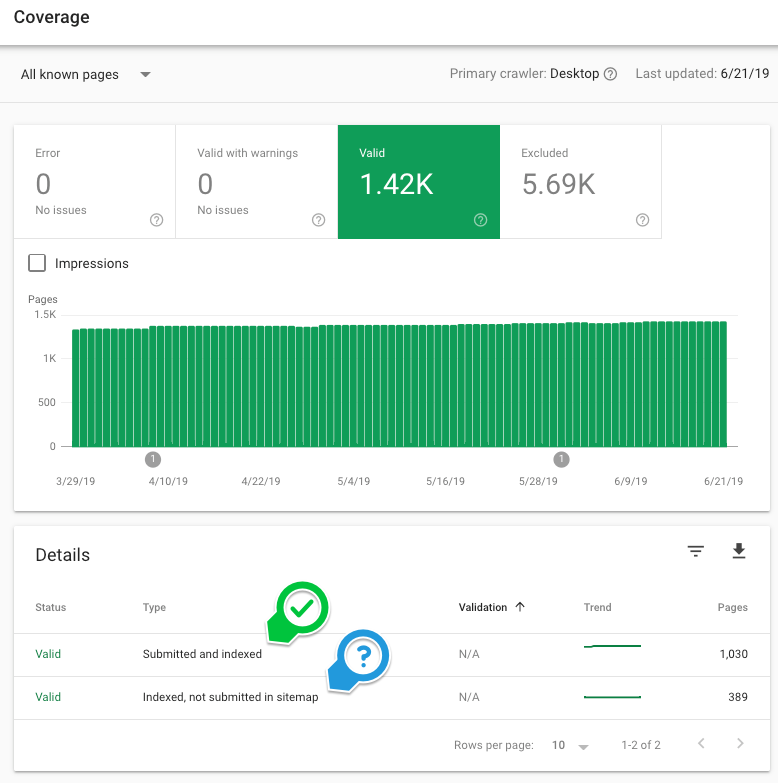
Open up your Google Search Console (GSC) property and go to the Index > Coverage report. Take a look at the valid pages. On this report, Google is telling you how many total URLs they have found on your site. Review the other reports as well, GSC can be a great tool to evaluate what the Googlebot is finding when it visits your site.

screenshot example of Google Search Console's coverage report

How many pages does Google say it’s indexing? Make a note of the number.

3. Your XML sitemaps

This one is a simple check. Visit your XML sitemap and count the number of URLs included. Is the number off? Are there unnecessary pages? Are there not enough pages?

Conduct a crawl with Screaming Frog, add your XML sitemap to the configuration and run a crawl analysis. Once it’s done, you can visit the Sitemaps tab to see which specific pages are included in your XML sitemap and which ones aren’t.

example of using Screaming Frog to run a crawl analysis of an XML sitemap

Make a note of the number of indexable pages.

4. Your own Content Management System (CMS)

This one is a simple check too, don’t overthink it. How many pages on your site do you have? How many blog posts do you have? Add them up. We’re looking for quality content that provides value, but more so in a quantitative fashion. It doesn’t have to be exact as the actual quality a piece of content has can be measured via a content audit.

Make a note of the number you see.

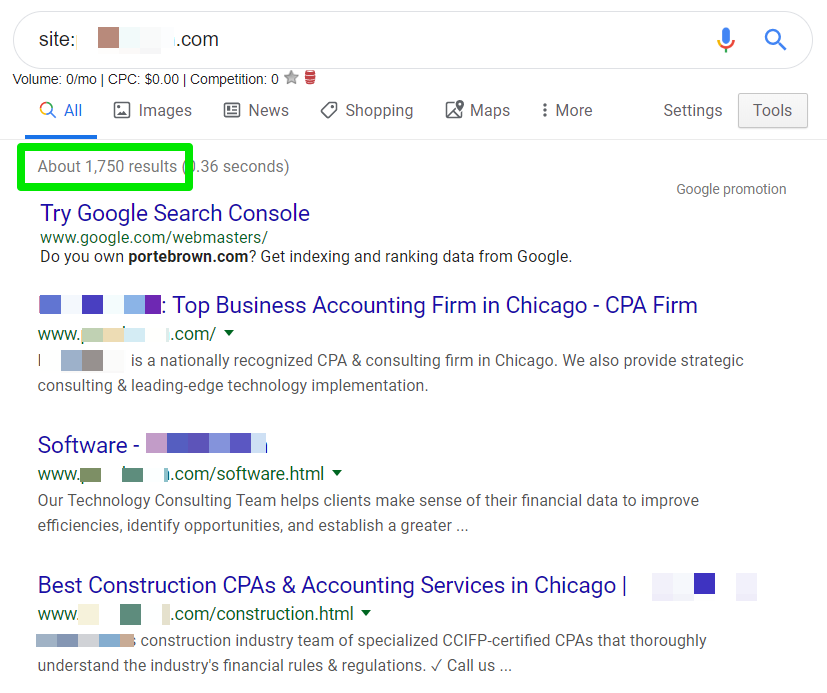
5. Google

At last, we come to the final check of our series. Sometimes Google throws a number at you and you have no idea where it comes from, but try to be as objective as possible. Do a “site:domain.com” search on Google and check how many results Google serves you from its index. Remember, this is purely a numeric value and does not truly determine the quality of your pages.

screenshot example of using Google search results to spot inefficient indexation

Make a note of the number you see and compare it to the other numbers you found. Any discrepancies you find indicates symptoms of an inefficient indexation. Completing a simple quantitative analysis will help direct you to areas that may not meet minimum qualitative criteria. In other words, comparing numeric values from multiple sources will help you find pages on your site that contain a low value.

The quality criteria we evaluate against can be found in Google’s Webmaster guidelines.

How to resolve index bloat

Resolving index bloat is a slow and tedious process, but you have to trust the optimizations you’re performing on the site and have patience during the process, as the results may be slow to become noticeable.

1. Deleting pages (Ideal)

In an ideal scenario, low-quality pages would not exist on your site, and thus, not consume any limited resources from search engines. If you have a large number of outdated pages that you no longer use, cleaning them up (deleting) can often lead to other benefits like fewer redirects and 404s, fewer thin-content pages, less room for error and misinterpretation from search engines, to name a few.

The less control you give search engines by limiting their options on what action to take, the more control you will have on your site and your SEO.

Of course, this isn’t always realistic. So here are a few alternatives.

2. Using Noindex (Alternative)

When you use this method at the page level please don’t add a site-wide noindex – happens more often than we’d like), or within a set of pages, is probably the most efficient as it can be completed very quickly on most platforms.

  • Do you use all those testimonial pages on your site?
  • Do you have a proper blog tag/category in place, or are they just bloating the index?
  • Does it make sense for your business to have all those blog author pages indexed?

All of the above can be noindexed and removed from your XML sitemap(s) with a few clicks on WordPress if you use Yoast SEO or All in One SEO.

3. Using Robots.txt (Alternative)

Using the robots.txt file to disallow sections or pages of your site is not recommended for most websites unless it has been explicitly recommended by an SEO Expert after auditing your website. It’s incredibly important to look at the specific environment your site is in and how a disallow of certain pages would affect the indexation of the rest of the site. Making a careless change here may result in unintended consequences.

Now that we’ve got that disclaimer out of the way, disallowing certain areas of your site means that you’re blocking search engines from even reading those pages. This means that if you added a noindex, and also disallowed, Google won’t even get to read the noindex tag on your page or follow your directive because you’ve blocked them from access. Order of operations, in this case, is absolutely crucial in order for Google to follow your directives.

4. Using Google Search Console’s manual removal tool (Temporary)

As a last resort, an action item that does not require developer resources is using the manual removal tool within the old Google Search Console. Using this method to remove pages, whole subdirectories, and entire subdomains from Google Search is only temporary. It can be done very quickly, all it takes is a few clicks. Just be careful of what you’re asking Google to deindex.

A successful removal request lasts only about 90 days, but it can be revoked manually. This option can also be done in conjunction with a noindex meta tag to get URLs out of the index as soon as possible.

Conclusion

Search engines despise thin content and try very hard to filter out all the spam on the web, hence the never-ending search quality updates that happen almost daily. In order to appease search engines and show them all the amazing content we spent so much time creating, webmasters must make sure their technical SEO is buttoned up as early in the site’s lifespan as possible before index bloat becomes a nightmare.

Using the different methods described above can help you diagnose any index bloat affecting your site so you can figure out which pages need to be deleted. Doing this will help you optimize your site’s overall quality evaluation in search engines, rank better, and get a cleaner index, allowing Google to find the pages you’re trying to rank quickly and efficiently.

Pablo Villalpando is a Bilingual SEO Strategist for Victorious. He can be found on Twitter 

Related reading

Six HTTP status codes most critical to your SEO success

Seven time-tested tactics to generate more Google reviews

Three tools providing actionable competitive research insight

Google Sandbox Is it still affecting new sites in 2019

Report: Amazon Prime Day isn’t just for Prime members any more

Amazon’s days of owning the biggest shopping day(s) of the summer may be numbered. Large retailers, companies with more than $1 billion in annual revenue, experienced a 64% increase in sales during the first day Prime Day this year, compared to their average Monday sales, according to Adobe. That’s up from last year when the same retailers saw a 54% lift in sales.

“The first day of Prime Day saw a substantial increase in online spending the U.S., suggesting that Amazon is no longer the sole winner of the summer shopping holiday,” says Adobe.

Sales lisfts for small retailers

Adobe reports small, niche retailers are also benefiting from Amazon’s Prime Day. Businesses with less than $5 million in annual revenue saw a 30% increase in online sales during the first day of Prime Day 2019.

Overall, retailers outside of Amazon experienced an increase in web traffic to their sites during the first 24 hours of Prime Day, accounting for 66% of revenue lift.

Email driving revenue

Email marketing efforts delivered big for brands on Prime Day, according to Adobe: “Brands that delivered excellent email experiences saw a 50% lift in revenue. In comparison, those that lacked a good email strategy saw only a 17% lift.”

Adobe said that, overall, email campaigns accounted for a 7.6% higher share of revenue.

Amazon’s results so far

Amazon reported Monday’s Prime Day was the “biggest 24-hour sales day” in the company’s history. This is the first time Amazon extended Prime Day to two days, so there is still another day to go.

“Prime Day is off to a tremendous start for Marlowe with sales up 2,000% over Prime Day last year. Our Pomade – launched yesterday – is the fastest growing product we’ve ever had,” said a representative from Marlowe, an Amazon seller offering a line of men’s facial and hair products. Sweet Water Décor, another SMB on Amazon, reported a 255% lift in sales during the first day of Prime Day.

Why we should care

Adobe’s data shows that Monday’s Prime Day represented the third time e-commerce spending exceeded $2 billion in sales outside of the holiday season. Labor Day 2018 and Memorial Day 2019 were the other days that passed $2 billion. Prime Day is also now considered the kick-off to back to school shopping season according to many in the industry.

Many online retailers find themselves competing with Amazon year round, but the company’s summer shopping extravaganza has proven to be a boon for savvy advertisers who have figured out how to take advantage of Prime Day promotions.

A survey from Adlucent showed 68% of online shoppers plan to comparison shop outside of Amazon on Prime day — giving retailers an opportunity to pull consumers away from Prime Day sales.


About The Author

Amy Gesenhues is a senior editor for Third Door Media, covering the latest news and updates for Marketing Land, Search Engine Land and MarTech Today. From 2009 to 2012, she was an award-winning syndicated columnist for a number of daily newspapers from New York to Texas. With more than ten years of marketing management experience, she has contributed to a variety of traditional and online publications, including MarketingProfs, SoftwareCEO, and Sales and Marketing Management Magazine. Read more of Amy’s articles.