Search Console reporting for your site’s Discover performance data

Discover is a popular way for users to stay up-to-date on all their favorite topics, even when they’re not searching. To provide publishers and sites visibility into their Discover traffic, we’re adding a new report in Google Search Console to share relevant statistics and help answer questions such as:

  • How often is my site shown in users’ Discover? How large is my traffic?
  • Which pieces of content perform well in Discover?
  • How does my content perform differently in Discover compared to traditional search results?

A quick reminder: What is Discover?

Discover is a feature within Google Search that helps users stay up-to-date on all their favorite topics, without needing a query. Users get to their Discover experience in the Google app, on the Google.com mobile homepage, and by swiping right from the homescreen on Pixel phones. It has grown significantly since launching in 2017 and now helps more than 800M monthly active users get inspired and explore new information by surfacing articles, videos, and other content on topics they care most about. Users have the ability to follow topics directly or let Google know if they’d like to see more or less of a specific topic. In addition, Discover isn’t limited to what’s new. It surfaces the best of the web regardless of publication date, from recipes and human interest stories, to fashion videos and more. Here is our guide on how you can optimize your site for Discover.

Discover in Search Console

The new Discover report is shown to websites that have accumulated meaningful visibility in Discover, with the data shown back to March 2019. We hope this report is helpful in thinking about how you might optimize your content strategy to help users discover engaging information– both new and evergreen.

For questions or comments on the report, feel free to drop by our webmaster help forums, or contact us through our other channels.

How to get international insights from Google Analytics

international insight from google analytics

Your international marketing campaigns hinge on one crucial element: how well you have understood your audience.

As with all marketing, insight into the user behavior, preferences and needs of your market is a must. However, if you do not have feet on the ground in these markets, you may be struggling to understand why your campaigns are not hitting the mark.

Thankfully you have a goldmine of data about your customers’ interests, behavior, and demographics already at your fingertips. Wherever your international markets are, Google Analytics should be your first destination for drawing out actionable insights.

Setting up Google Analytics for international insight

Google Analytics is a powerful tool but the sheer volume of data available through it can make finding usable insights tough. The first step for getting the most out of Google Analytics is ensuring it has been set up in the most effective way. This needs to encompass the following:

Also read: An SEO’s guide to Google Analytics terms

1. Setting up views for geographic regions

Depending on your current Google Analytics set-up you may already have more than one profile and view for your website data. What insight you want to get from your data will influence how you set up this first stage of filtering. If you want to understand how the French pages are being accessed and interacted with then you may wish to create a filter based on the folder structure of your site, such as the “/fr-fr/” sub-folder of your site.

However, this will show you information on visitors who arrive on these pages from any geographic location. If your hreflang tags aren’t correct and Google is serving your French pages to a Canadian audience, then you will be seeing Canadian visitors’ data under this filter too.

If you are interested in only seeing how French visitors interact with the website, no matter where on the site they end up, then a geographic filter is better. Here’s an example.

Example of geographic filter in Google Analytics

2. Setting up segments per target area

Another way of being able to identify how users from different locations are responding to your website and digital marketing is by setting up segments within Google Analytics based on user demographics. Segments enable you to see a subset of your data that, unlike filters, don’t permanently alter the data you are viewing. Segments will allow you to narrow down your user data based on a variety of demographics, such as which campaign led them to the website, the language in which they are viewing the content, and their age. To set up a segment in Google Analytics click on “All Users” at the top of the screen. This will bring up all of the segments currently available in your account.

Example of user segmentation in Google Analytics

To create a new segment click “New Segment” and configure the fields to include or exclude the relevant visitors from your data. For instance, to get a better idea of how French-Canadian visitors interact with your website you might create a segment that only includes French-speaking Canadians. To do this you can set your demographics to include “fr-fr” in the “Language” field and “Canada” in the “Location” field.

Example of creating a new location-based user segment

Use the demographic fields to tailor your segment to include visitors from certain locations speaking specific languages.

The segment “Summary” will give you an indication of what proportion of your visitors would be included in this segment which will help you sense-check if you have set it up correctly. Once you have saved your new segment it will be available for you to overlay onto your data from any time period, even from before you set up the segment. This is unlike filters, which will only apply to data recorded after the filter was created.

Also read: A guide to the standard reports in Google Analytics – Audience reports 

3. Ensuring your channels are recording correctly

A common missing step to setting your international targeting up on Google Analytics is ensuring the entry points for visitors onto your site are tracking correctly.

For instance, there are a variety of international search engines that Google Analytics counts as “referral” sources rather than organic traffic sources unless a filter is added to change this.

The best way to identify this is to review the websites listed as having driven traffic to your website, follow the path – Acquisition > All Traffic > Referrals. If you identify search engines among this list then there are a couple of solutions available to make sure credit for your marketing success is being assigned correctly.

First, visit the “Organic Search Sources” section in Google Analytics which can be found under Admin > Property > Organic Search Sources.

Example of setting websites as "Organic Search Sources" in Google Analytics

From here, you can simply add the referring domain of the search engine that is being recorded as a “referral” to the form. Google Analytics should start tracking traffic from that source as organic. Simple. Unfortunately, it doesn’t always work for every search engine.

If you find the “Organic Search Sources” solution isn’t working, filters are a fool-proof solution but be warned, this will alter all your data in Google Analytics from the point the filter is put in place. Unless you have a separate unfiltered view available (which is highly recommended) then the data will not be recoverable and you may struggle to get an accurate comparison with data prior to the filter implementation. To set up a view without a filter you simply need to navigate to “Admin” and under “View” click “Create View”.

Example of creating a view without filters in Google Analytics

Name your unfiltered view “Raw data” or similar that will remind you that this view needs to remain free of filters.

Example of creating a new reporting view without filters in Google Analytics

To add a filter to the Google Analytics view that you want to have more accurate data in, go to “Filters” under the “View” that you want the data to be corrected for.

Click “Add Filter” and select the “Custom” option. To change traffic from referral to organic, copy the below settings:

Filter Type: Advanced

Field A – Extract A: Referral (enter the domain of the website you want to reclassify traffic from)

Field B – Extract B: Campaign Medium – referral

Output To – Constructor: Campaign Medium – organic

Then ensure the “Field A Required”, “Field B Required”, and “Override Output Field” options are selected.

You may also notice the social media websites are listed among the referral sources. The same filter process applies to them.  Just enter “social” rather than “organic” under the “Output To” field.

Example of a filter in Google Analytics to reclassify yahoo.com traffic from referral to organic

4. Setting goals per user group

Once you have a better idea of how users from different locations use your website you may want to set up some independent goals specific to those users in Google Analytics. This could be, for example, a measure of how many visitors download a PDF in Chinese. This goal might not be pertinent to your French visitors’ view, but it is a very important measure of how well your website content is performing for your Chinese audience.

The goals are simple to create in Google Analytics, just navigate to “Admin”, and under the view that you want to add the goal to click “Goals”.  This will bring up a screen that displays any current goals set up in your view and, if you have edit level permissions in Google Analytics, you can create a new one by clicking “New Goal”.

Example of creating new goals in Google Analytics

Once you have selected “New Goal” you will be given the option of setting up a goal from a template or creating a custom one. It is likely that you will need to configure a custom goal in order to track specific actions based off of events or page destinations. For example, if you are measuring how many people download a PDF you may track the “Download” button click events, or you may create a goal based on visitors going to the “Thank you” page that is displayed once a PDF is downloaded.

Example of tracking visitors' specific events by setting goals

Most goals will need to be custom ones that allow you to track visitors completing specific events or navigating to destination pages.

With the number of goals you can set up under each view (which is limited to 20), it is likely that your goals will be different under each in order to drive the most relevant insight.

5. Filtering tables by location

An easy way to determine location-specific user behavior is using the geographic dimensions to further drill-down into the data that you are viewing.

For instance, if you run an experiential marketing campaign in Paris to promote awareness of your products, then viewing the traffic that went to the French product pages of your website that day compared to a previous day could give you an indicator of success. However, what would be even more useful would be to see if interest in the website spiked for visitors from Paris.

By applying “City” as a secondary dimension on the table of data you are looking at how you can get a more specific overview of how well the campaign performed in that region.

Example of adding secondary dimensions to analyze campaign success

Dimensions available include “Continent”, “Sub-continent” “Country”, “Region”, and “City”, as well as being able to split the data by “Language”.

Also read: How to integrate SEO into the translation process to maximize global success

Drawing intelligence from your data

Once you have your goals set up correctly you will be able to drill much further down into the data Google Analytics is presenting you with. An overview of how international users are navigating your site, interacting with content and their pain points is valuable in determining how to better optimize your website and marketing campaigns for conversion.

1. Creating personas

Many organizations will have created user personas at one stage or another, but it is valuable to review them periodically to ensure they are still relevant in the light of changes to your organization or the digital landscape. It is imperative that your geographic targeting has been set up correctly in Google Analytics to ensure your personas drive insight into your international marketing campaigns.

Creating personas using Google Analytics ensures they are based on real visitors who land on your website. This article from my agency, Avenue Digital, gives you step by step guidance on how to use your Google Analytics data to create personas, and how to use them for SEO.

2. Successful advertising mediums

One tip for maximizing the data in Google Analytics is discerning what the most profitable advertising medium is for that demographic.

If you notice that a lot of your French visitors are coming to the website as a result of a PPC campaign advertising your products, but the traffic that converts the most is actually from Twitter, then you can focus on expanding your social media reach in that region.

This may not be the same for your UK visitors who might arrive on the site and convert most from organic search results. With the geographic targeting set up correctly in Google Analytics, you will be able to focus your time and budgets more effectively for each of your target regions, rather than employing a blanket approach based on unfiltered data.

3. Language

Determining the best language to provide your marketing campaigns and website may not be as simple as identifying the primary language for each country you are targeting. For example, Belgium has three official languages – Dutch, German, and French. Google Analytics can help you narrow down which of these languages is primarily used by the demographic that interacts with you the most online.

If you notice that there are a lot of visitors from French-speaking countries landing on your website, but it is only serving content in English, then this forms a good base for diversifying the content on your site.

4. Checking the correctness of your online international targeting

An intricate and easy to get wrong aspect of international marketing is signaling to the search engines what content you want available to searchers in different regions.

Google Analytics allows you to audit how well international targeting has been understood and respected by the search engines. If you have filtered your data by a geographic section of your website, like, /en-gb/ but a high proportion of your organic traffic landing on this section of the site is from countries that have their own specified pages on the site, then this would suggest that your hreflang tags may need checking.

5. Identifying emerging markets

Google Analytics could help identify other markets that are not being served by your current products, website or marketing campaigns that could prove very fruitful if tapped into.

If through your analysis you notice that there is a large volume of visitors from a country you don’t currently serve then you can begin investigations into the viability of expanding into those markets.

Conclusion

As complex as Google Analytics may seem, once you have set it up right expect to get clarity over your data, as it makes drilling down into detail for each of your markets an easy job. The awareness into your markets you gain can be the difference between your digital marketing efforts soaring or falling flat.

Helen Pollitt is the Head of SEO Avenue Digital. She can be found on Twitter .

Related reading

Doing backlink building like a ninja

Luxury marketing search strategy series

Google Dataset Search How you can use it for SEO

Google featured snippet - A short guide for 2019

CMOs spent 29 percent of 2018 marketing budget on marketing technology

Marketing technology increasingly accounts for a significant share of marketing budgets, and 2018 was no different. According to Gartner’s CMO survey, Martech ate up nearly a third of marketing budgets, making marketing technology the largest area of investment for marketing resources and programs. And, according to the survey, it’s expected to grow with continued investments in 2019.

According to the survey, CMOs spent an average of 25 percent of their martech budget on three channels: search (11.2 percent), email (5.9 percent), and website (7.6 percent).  Marketing and customer analytics platforms accounted for 8.9 percent, indicating the need for measurement tools to continue supporting these programs.

Why you should care

As martech investments increase, marketers should expect increased visibility into digital marketing performance. Direct channel attribution should be a top priority for digital marketers and organizations looking to innovate and advance their marketing programs.

Other key findings

  • Marketing expense budgets leveled off in 2018, remaining steady at an average of 11.2 percent of company revenue.
  • Marketing technology now accounts for almost a third of marketing’s budget, while in-house labor investment loses shares.
  • One in every $6 spent by CMOs is invested in innovation, despite doubts in the skills and capabilities available to support these programs.
  • CMOs struggle to align marketing metrics with business priorities, favoring awareness as their No. 1 strategic measure instead of customer value and return on investment (ROI).

About The Author

A survival kit for SEO-friendly JavaScript websites

how to make SEO-friendly Javascript websites

JavaScript-powered websites are here to stay. As JavaScript in its many frameworks becomes an ever more popular resource for modern websites, SEOs must be able to guarantee their technical implementation is search engine-friendly.

In this article, we will focus on how to optimize JS-websites for Google (although Bing also recommends the same solution, dynamic rendering).

The content of this article includes:

1.    JavaScript challenges for SEO

2.    Client-side and server-side rendering

3.    How Google crawls websites

4.    How to detect client-side rendered content

5.    The solutions: Hybrid rendering and dynamic rendering

1. JavaScript challenges for SEO

React, Vue, Angular, Node, and Polymer. If at least one of these fancy names rings a bell, then most likely you are already dealing with a JavaScript-powered website.

All these JavaScript frameworks provide great flexibility and power to modern websites.

They open a large range of possibilities in terms of client-side rendering (like allowing the page to be rendered by the browser instead of the server), page load capabilities, dynamic-content, user-interaction, and extended functionalities.

If we only look at what has an impact on SEO, JavaScript frameworks can do the following for a website:

  • Load content dynamically based on users’ interactions
  • Externalize the loading of visible content (see client-side rendering below)
  • Externalize the loading of meta-content or code (for example, structured data)

Unfortunately, if implemented without using a pair of SEO lenses, JavaScript frameworks can pose serious challenges to the page performance, ranging from speed deficiencies to render-blocking issues, or even hindering crawlability of content and links.

There are many aspects that SEOs must look after when auditing a JavaScript-powered web page, which can be summarized as follows:

  1. Is the content visible to Googlebot? Remember the bot doesn’t interact with the page (images, tabs, and more).
  2. Are links crawlable, hence followed? Always use the anchor (<a>) and the reference (href=), even in conjunction with the “onclick” events.
  3. Is the rendering fast enough?
  4. How does it affect crawl efficiency and crawl budget?

A lot of questions to answer. So where should an SEO start?

Below are key guidelines to the optimization of JS-websites, to enable the usage of these frameworks while keeping the search engine bots happy.

2. Client-side and server-side rendering: The best “frenemies”

Probably the most important pieces of knowledge all SEOs need when they have to cope with JS-powered websites is the concepts of client-side and server-side rendering.

Understanding the differences, benefits, and disadvantages of both are critical to deploying the right SEO strategy and not getting lost when speaking with software engineers (who eventually are the ones in charge of implementing that strategy).

Let’s look at how Googlebot crawls and indexes pages, putting it as a very basic sequential process:

how googlebot crawls and indexes pages

1. The client (web browser) places several requests to the server, in order to download all the necessary information that will eventually display the page. Usually, the very first request concerns the static HTML document.

2. The CSS and JS files, referred to by the HTML document, are then downloaded: these are the styles, scripts and services that contribute to generating the page.

3. The Website Rendering Service (WRS) parses and executes the JavaScript (which can manage all or part of the content or just a simple functionality).
This JavaScript can be served to the bot in two different ways:

  • Client-side: all the job is basically “outsourced” to the WRS, which is now in charge of loading all the script and necessary libraries to render that content. The advantage for the server is that when a real user requests the page, it saves a lot of resources, as the execution of the scripts happens on the browser side.
  • Server-side: everything is pre-cooked (aka rendered) by the server, and the final result is sent to the bot, ready for crawling and indexing. The disadvantage here is that all the job is carried out internally by the server, and not externalized to the client, which can lead to additional delays in the rendering of further requests.

4. Caffeine (Google’s indexer) indexes the content found

New links are discovered within the content for further crawling

This is the theory, but in the real world, Google doesn’t have infinite resources and has to do some prioritization in the crawling.

3. How Google actually crawls websites

Google is a very smart search engine with very smart crawlers.

However, it usually adopts a reactive approach when it comes to new technologies applied to web development. This means that it is Google and its bots that need to adapt to the new frameworks as they become more and more popular (which is the case with JavaScript).

For this reason, the way Google crawls JS-powered websites is still far from perfect, with blind spots that SEOs and software engineers need to mitigate somehow.

This is in a nutshell how Google actually crawls these sites:

how googlebot crawls a JS rendered site

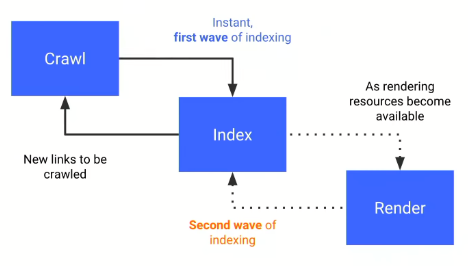
The above graph was shared by Tom Greenaway in Google IO 2018 conference, and what it basically says is – If you have a site that relies heavily on JavaScript, you’d better load the JS-content very quickly, otherwise we will not be able to render it (hence index it) during the first wave, and it will be postponed to a second wave, which no one knows when may occur.

Therefore, your client-side rendered content based on JavaScript will probably be rendered by the bots in the second wave, because during the first wave they will load your server-side content, which should be fast enough. But they don’t want to spend too many resources and take on too many tasks.

In Tom Greenaway’s words:

“The rendering of JavaScript powered websites in Google Search is deferred until Googlebot has resources available to process that content.”

Implications for SEO are huge, your content may not be discovered until one, two or even five weeks later, and in the meantime, only your content-less page would be assessed and ranked by the algorithm.

What an SEO should be most worried about at this point is this simple equation:

No content is found = Content is (probably) hardly indexable

And how would a content-less page rank? Easy to guess for any SEO.

So far so good. The next step is learning if the content is rendered client-side or server-side (without asking software engineers).

4. How to detect client-side rendered content

Option one: The Document Object Model (DOM)

There are several ways to know it, and for this, we need to introduce the concept of DOM.

The Document Object Model defines the structure of an HTML (or an XML) document, and how such documents can be accessed and manipulated.

In SEO and software engineering we usually refer to the DOM as the final HTML document rendered by the browser, as opposed to the original static HTML document that lives in the server.

You can think of the HTML as the trunk of a tree. You can add branches, leaves, flowers, and fruits to it (that is the DOM).

What JavaScript does is manipulate the HTML and create an enriched DOM that adds up functionalities and content.

In practice, you can check the static HTML by pressing “Ctrl+U” on any page you are looking at, and the DOM by “Inspecting” the page once it’s fully loaded.

Most of the times, for modern websites, you will see that the two documents are quite different.

Option two: JS-free Chrome profile 

Create a new profile in Chrome and disallow JavaScript through the content settings (access them directly here –  Chrome://settings/content).

Any URL you browse with this profile will not load any JS content. Therefore, any blank spot in your page identifies a piece of content that is served client-side.

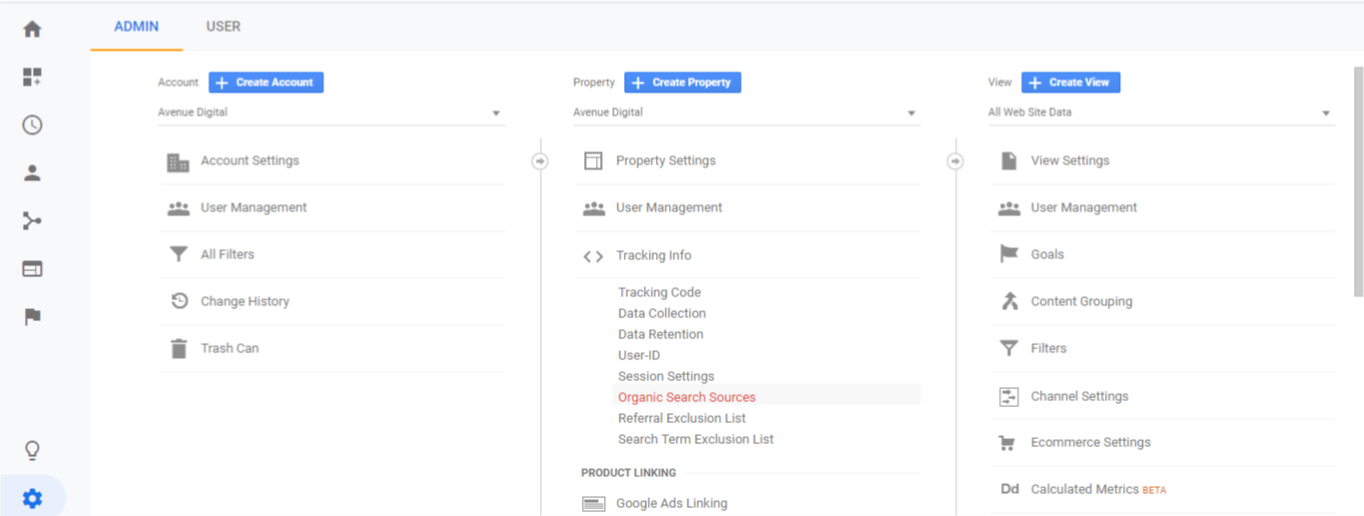
Option three: Fetch as Google in Google Search Console

Provided that your website is registered in Google Search Console (I can’t think of any good reason why it wouldn’t be), use the “Fetch as Google” tool in the old version of the console. This will return a rendering of how Googlebot sees the page and a rendering of how a normal user sees it. Many differences there?

Option four: Run Chrome version 41 in headless mode (Chromium) 

Google officially stated in early 2018 that they use an older version of Chrome (specifically version 41, which anyone can download from here) in headless mode to render websites. The main implication is that a page that doesn’t render well in that version of Chrome can be subject to some crawling-oriented problems.

Option five: Crawl the page on Screaming Frog using Googlebot

And with the JavaScript rendering option disabled. Check if the content and meta-content are rendered correctly by the bot.

After all these checks, still, ask your software engineers because you don’t want to leave any loose ends.

5. The solutions: Hybrid rendering and dynamic rendering

Asking a software engineer to roll back a piece of great development work because it hurts SEO can be a difficult task.

It happens frequently that SEOs are not involved in the development process, and they are called in only when the whole infrastructure is in place.

We SEOs should all work on improving our relationship with software engineers and make them aware of the huge implications that any innovation can have on SEO.

This is how a problem like content-less pages can be avoided from the get-go. The solution resides on two approaches.

Hybrid rendering

Also known as Isomorphic JavaScript, this approach aims to minimize the need for client-side rendering, and it doesn’t differentiate between bots and real users.

Hybrid rendering suggests the following:

  1. On one hand, all the non-interactive code (including all the JavaScript) is executed server-side in order to render static pages. All the content is visible to both crawlers and users when they access the page.
  2. On the other hand, only user-interactive resources are then run by the client (the browser). This benefits the page load speed as less client-side rendering is needed.
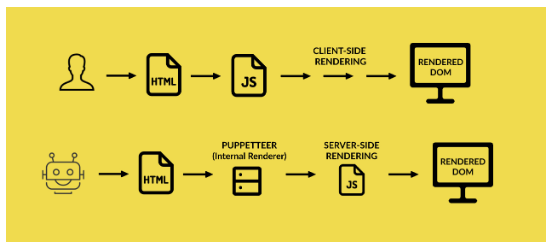
Dynamic rendering

This approach aims to detect requests placed by a bot vs the ones placed by a user and serves the page accordingly.

  1. If the request comes from a user: The server delivers the static HTML and makes use of client-side rendering to build the DOM and render the page.
  2. If the request comes from a bot: The server pre-renders the JavaScript through an internal renderer (such as Puppeteer), and delivers the new static HTML (the DOM, manipulated by the JavaScript) to the bot.

how google does dynamic rendering javascript sites

The best of both worlds

Combining the two solutions can also provide great benefit to both users and bots.

  1. Use hybrid rendering if the request comes from a user
  2. Use server-side rendering if the request comes from a bot

Conclusion

As the use of JavaScript in modern websites is growing every day, through many light and easy frameworks, it requires software engineers to solely rely on HTML to please search engine bots which are not realistic nor feasible.

However, the SEO issues raised by client-side rendering solutions can be successfully tackled in different ways using hybrid rendering and dynamic rendering.

Knowing the technology available, your website infrastructure, your engineers, and the solutions can guarantee the success of your SEO strategy even in complicated environments such as JavaScript-powered websites.

Giorgio Franco is a Senior Technical SEO Specialist at Vistaprint.

Related reading

Google Dataset Search How you can use it for SEO

Google featured snippet - A short guide for 2019

Five ways to improve your website's bounce rate (and why you should)

Debunked Nine link building myths you should ignore in 2019

How to wed multiple martech stacks when companies merge

Poly’s Zack Alves, LogMeIn’s Justin Sharaf and CabinetM’s Sheryl Schultz.

SAN JOSE, CA — “If you are in marketing operations right now, you know that rationalizing a single stack is hard. Bringing together two stacks or more is really complex,” said CabinetM COO Sheryl Schultz at this year’s MarTech Conference.

Schultz moderated the “When Stacks Collide” session featuring Poly (formerly Plantronics) senior manager of marketing technology Zack Alves and LogMeIn director of marketing operations Justin Sharaf. Both Alves and Sharaf have led their teams through major company acquisitions, having to manage the process of integrating multiple martech stacks into one stack that met everyone’s needs.

Three rules for blending stacks. LogMeIn has acquired more than ten companies in the past seven years, at one time growing from 1,200 to 3,500 employees in one afternoon. To manage the chaos of bringing two separate martech stacks together at such times, Sharaf has developed three specific rules.

He said his first rule is to find a “best-fit” technology. It’s not about selecting the most popular platforms, but choosing a solution that fits the company’s needs. Second, he makes sure the technologies he chooses fit within the existing technology ecosystem, and are scalable. Last, he avoids redundancy.

“We made sure when there was redundancy, we could consolidate,” said Sharaf about the LogMeIn’s martech stack when the company acquired GetGo in 2017.

Before deciding on a martech solution, Sharaf makes sure the technology passes security and compliance standards. He has also created a system to document each solution’s capabilities that is accessible to everyone in the company and has set up a leadership counsel so that stakeholders have the opportunity to offer their thoughts on what is important. Sharaf said getting leadership sign-off on any new technology is a priority.

“Once it was clear there was no redundancy and the proper sign-offs were given, only then would we start to evaluate the technology,” said Sharaf.

When your martech stack doubles in size. When Plantronics, a headset company that has been around since 1961, acquired Polycom in 2018, its martech stack doubled in size, with more than 120 new marketing technologies suddenly available.

“It felt like Christmas morning at first,” said Alves of all the new solutions. But then, he said, the reality set in. “You have a bunch of different toys from different play sets.”

Not only did the martech stack grow exponentially, the business teams doubled in size overnight with roles and responsibilities shifting and reorgs happening. (Just last month, Plantronics rebranded as Poly.) During this time, Alves said one of the most crucial factors to ensure his team’s success was the ability to build alliances within the new company structure.

“Find those new go-to people, and go to them,” said Alves, “You’re going to need those relationships when you’re selling ideas later on.”

Alves said it was important that his martech organization presented itself as a team of marketers who wanted to advance the company’s vision, which meant finding opportunity in the unknown when a lot of people were saying no to new ideas. To do so, his group gathered as much data on the company’s technology as possible.

More about the MarTech Conference

“We wanted to make sure we were very organized and had a version of the truth we could react to,” said Alves, who also admitted it’s extremely important in the early stages of a merger to pick your battles. “I can’t emphasize this enough. You don’t need to die on every hill.”

Alves believes anyone trying to put their fingerprints on every project runs the risk of failing to succeed in the core mission.

Tactical actions to take during the first year. Sharaf and Alves agreed that if you can’t find a champion for any given marketing technology tool, then it’s gone. Clearing redundancy was also an important task for both Sharaf and Alves during the early stages of combining multiple martech stacks.

Alves was able to reduce three different marketing automation platforms to one that aligned with his company’s CRM system during the initial phases of blending Plantronics and Polycom’s martech stacks.

Reviewing all of your martech contracts is another important step to take early on so you can identify which contracts auto-renew and avoid being locked into an agreement with a platform you don’t plan on using. There are also new opportunities to renegotiate contracts as your company’s martech needs grow.

“If you haven’t implemented a system where every new martech contract comes across your desk, do it tomorrow,” advises Sharaf.

Share your knowledge. To evaluate the need for each martech tool in the stack, Sharaf had his team interview LogMeIn’s marketing staff to find out who was using what tools and how they were using them. He said the research showed different people were using tools in different ways.

Sharaf then built a profile for every piece of tech in the martech stack. “It’s so powerful because it opens up that knowledge for everybody.” Before new products can be bought, or even renewed, Sharaf requires a written business case for the tool by the person requesting it.

When it comes to blending martech stacks, and the ongoing management of marketing technology, Schultz pointed out how it’s a never-ending process. “Every time you think you have everything in your stack identified, it changes.”

This story first appeared on MarTech Today. For more on marketing technology, click here.


About The Author

Amy Gesenhues is Third Door Media’s General Assignment Reporter, covering the latest news and updates for Marketing Land and Search Engine Land. From 2009 to 2012, she was an award-winning syndicated columnist for a number of daily newspapers from New York to Texas. With more than ten years of marketing management experience, she has contributed to a variety of traditional and online publications, including MarketingProfs.com, SoftwareCEO.com, and Sales and Marketing Management Magazine. Read more of Amy’s articles.

Five tools for audience research on a tiny budget

Five tools for audience research on a tiny budget

When starting out a digital marketing program, you might not yet have a lot of internal data that helps you understand your target consumer. You might also have smaller budgets that do not allow for a large amount of audience research.

So do you start throwing darts with your marketing? No way.

It is critical to understand your target consumer to expand your audiences and segment them intelligently to engage them with effective messaging and creatives. Even at a limited budget, you have a few tools that can help you understand your target audience and the audience that you want to reach. We will walk through a few of these tools in further detail below.

Five tools for audience research on a budget

Tool #1 – In-platform insights (LinkedIn)

If you already have a LinkedIn Ads account, you have a great place to gain insights on your target consumer, especially if you are a B2B lead generation business.

In order to pull data on your target market, you must place the LinkedIn insight tag on your site.

Once the tag has been placed, you will be able to start pulling audience data, which can be found on the website demographics tab. The insights provided include location, country, job function, job title, company, company industry, job seniority, and company size. You can look at the website as a whole or view specific pages on the site by creating website audiences. You can also compare the different audiences that you have created.

Screenshot of LinkedIn insights

Tool #2 – In-platform insights (Facebook)

Facebook’s Audience Insights tool allows you to gain more information about the audience interacting with your page. It also shows you the people interested in your competitors’ pages.

You can see a range of information about people currently interacting with your page by selecting “People connected to your page.”

To find out information about the users interacting with competitor pages, select “Interests” and type the competitor page or pages. The information that you can view includes age and gender, relationship status, education level, job title, page likes, location (cities, countries, and languages), and device used.

Screenshot of the "Insights" tab on Facebook Audience Insights

Tool #3 – In-platform insights (Google Customer Match)

Google Customer Match is a great way to get insights on your customers if you have not yet run paid search or social campaigns.

You can load in a customer email list and see data on your customers to include details like gender, age, parental status, location, and relevant Google Audiences (in-market audiences and affinity audiences). These are great options to layer onto your campaigns to gain more data and potentially bid up on these users or to target and bid in a separate campaign to stay competitive on broader terms that might be too expensive.

Screenshot of insights gained from Google Customer Match

Tool #4 – External insights (competitor research)

There are a few tools that help you conduct competitor research in paid search and paid social outside of the engines and internal data sources.

SEMrush and SpyFu are great for understanding what search queries you are showing up for organically. These tools also allow you to do some competitive research to see what keywords competitors are bidding for, their ad copy, and the search queries they are showing up for organically.

All of these will help you understand how your target consumer is interacting with your brand on the SERP.

MOAT and AdEspresso are great tools to gain insights into how your competition portrays their brand on the Google Display Network (GDN) and Facebook. These tools will show you the ads that are currently running on GDN and Facebook, allowing you to further understand messaging and offers that are being used.

Tool #5 – Internal data sources

There might not be a large amount of data in your CRM system, but you can still glean customer insights.

Consider breaking down your data into different segments, including top customers, disqualified leads, highest AOV customers, and highest lifetime value customers. Once you define those segments, you can identify your most-desirable and least-desirable customer groups and bid/target accordingly.

Conclusion

Whether you’re just starting a digital marketing program or want to take a step back to understand your target audience without the benefit of a big budget, you have options. Dig into the areas defined in this post, and make sure that however you’re segmenting your audiences, you’re creating ads and messaging that most precisely speak to those segments.

Lauren Crain is a Client Services Lead in 3Q Digital’s SMB division, 3Q Incubate.

Related reading

marketing automation for SEOs, five time-saving strategies

A primer to forecasting the value of SEO

How to get started with Data-Driven Attribution in Google Analytics

Conversation Mapping

Freshly CMO Mayur Gupta’s unexpected path from technologist to marketer

SAN JOSE, CA — Growing up in India, Freshly CMO Mayur Gupta said it was his mother who persuaded him to begin his career as an engineer.

“My mom inspired — or told me — to become an engineer,” said Gupta during his keynote session at this year’s MarTech Conference, “I listened to her and went down that path.” In the early days Gupta said he was like a hammer looking for a nail, just trying to write code as a technologist. Fast forward five years, his whole world change when he became a product lead at Sapient, moving from technology to marketing.

Engineering as a mindset. Gupta says it was an incredible experience for him, moving from technology into product management and eventually into strategy while at Sapien. The fundamental shift in Gupta’s career happened when he left Sapien after twelve years and was named chief marketing technologist for Kimberly Clark.

It was during his time at Kimberly Clark that he began to understand the work wasn’t just about the technology — it was about the outcomes. He began to see engineering as a mindset that could be applied to marketing.

“I wanted to apply that mindset to everything,” said Gupta, explaining that, as a technologist, his job was to simplify every single thing the company did. Once he gained a deeper understanding of how engineering and technology could be applied to every aspect of the business he began looking at data differently.

“How do you apply the data so you make the experience more relevant. More humanistic?” said Gupta.

CTO or CMO? A few years into his role as a chief marketing technologist, he knew he had to decide which career path he was going to take. He had to ask himself if he wanted to continue down the technology path with hopes of becoming a CTO one day, or did he want to go deeper into marketing?

“We’re all victims of marketing every single day,” joked Gupta. He took the marketing path, with the belief that marketers had to stop marketing. He coined the “engineering of marketing” ideology because, for him, traditional marketing didn’t make sense — what did make sense was applying what he knew about engineering to his marketing role.

“What I did know as an engineer was how to stitch it all together,” said Gupta. He says marketers must understand that your customers are your brand. That marketers need to sync the customer experience to deliver what consumers need before they know they need it.

“A mom waiting to buy her next package of diapers isn’t waiting for the next marketing campaign,” said Gupta. Marketers have to let go of thinking in terms of campaigns and channels because at the end of the day it is about outcomes and applying agile principles to the work.

Shaking up the marketing rules. For Gupta, marketing needs to focus on speed over perfection. He said that growing a brand is directly connected to the brand’s user value and user base. He doesn’t believe everything in marketing has to be measurable.

“While there is so much emphasis on data, we don’t have to be too data-driven.”

Gupta sees a distinct difference between data and insight: “While data can give you the facts, insight can give you the truth.”

What’s clear listening to Gupta talk about technology, marketing and his career, is how much he attaches what he does for brands with his own value system. His focus during the last three years has been on science as it relates to our culture.

“Learning the art of science and culture, learning to respect your belief system — because that’s what drives your culture.”

More insights from the MarTech Conference

This story first appeared on MarTech Today. For more on marketing technology, click here.


About The Author

Amy Gesenhues is Third Door Media’s General Assignment Reporter, covering the latest news and updates for Marketing Land and Search Engine Land. From 2009 to 2012, she was an award-winning syndicated columnist for a number of daily newspapers from New York to Texas. With more than ten years of marketing management experience, she has contributed to a variety of traditional and online publications, including MarketingProfs.com, SoftwareCEO.com, and Sales and Marketing Management Magazine. Read more of Amy’s articles.

Visual content creation tools for stunning social media campaigns

Visual content creation tools for stunning social media campaigns

Hubspot found that 80% of marketing professionals lean on visual content in their social media marketing.

It makes enormous good sense to assert that social media marketing is moving towards a direction where image and video content shall play pivotal roles.

Traditionally, content marketing has performed three roles:

  1. Factually accurate content informs users
  2. Stand-out content reminds them
  3. Visual content convinces them

There are statistics that provide mounting evidence to the vitality of leveraging a visual content marketing strategy.

Key insights on the changing face of visual content marketing

  1. With more than 2.5 billion camera phones in use, visual content creation is more accessible, affordable, and available to users than ever before.
  2. Cisco found that by the year 2021, 82% of all IP traffic shall consist of video.
  3. Image content enables brands to gain more traction in the market by increasing subscription users up to 329%.
  4. Hootsuite found that a single piece of visual content has the same effect on the human mind as 60,000 words.
  5. The Graduate School of Business, Stanford University that in fact offers a dedicated academic program called the Symbolic Systems Program, that reinforces the impact of visual content in the digital era of technology-driven marketing.

How do images and video content create value for brands on social media?

Prima facie, visual content augments value creation on social media in the following ways:

  1. The human brain is designed to process a visual image in 1/10th of a second. The obvious implication of this is that visuals enable brands to send across their brand philosophy to users in the smallest window of time and very often at a glance.
  2. Visual content allows brands to showcase their key brand differentiators in the most seamless way possible. Take for example the short video that shows Coca Cola draping its bottles in beautiful red ribbons with the names of users written on the bodies of the bottles to personalize their selling. With this video, Coca Cola redefined personal selling on social media like never before.
  3. Brands that leverage visual content for social media marketing reported a quantum leap in their traffic conversion rates and user engagements. In fact, as per Buzzsumo, images posted on Facebook get 2.3X more engagement than those without images. Dropbox had tried creating a face for its brand by investing an outlay of $50,000 in the creation of a video that saw its conversion rate jumping by 10%.

Challenge of leveraging visual content successfully for social media marketing

Accenture Interactive had conducted a survey on a sample of more than 1000 consumers that sought to objectively assess their tastes and preferences, habits, likes and dislikes of content consumption, and thus, identify patterns and insights on visual content marketing and consumption. The findings submitted as part of the Accenture Interactive research stated that visual content and especially video is still considered invasive by a large chunk of people.

The findings stated on page six of the report published clearly asserts that 35% of users find the use of video content for advertising inconvenient and invasive as opposed to 26% users that stated they prefer to see video advertisements.

Features of an awesome visual content design tool for social media marketing

Given the importance of visual content in the context of social media marketing and the abundance of design tools for creating visual content for the aforesaid purpose, it is worthwhile to explore the features, functionality, and performance parameters that make for a great design tool.

Other important aspects like ease of use, pricing, integration with other social media apps, and the spectrum of content prototypes that can be created using these design tools including but not limited to infographics, graphs, pie charts, bar charts, and scatter diagrams.

Some of the major parameters in assessing the merit of a great design tool for creating visual content are as follows:

  • Ease of use
  • Social media marketing integration
  • User experience
  • Choice of templates
  • Custom design
  • Pricing

The best visual content design tools for social media marketing

With the knowledge of the parameters that you got to be focusing on, from the perspective of visual content creation for social media marketing, it is easy to identify a list of the best such design tools that are available and in demand for the said job. Have a look.

1. Bannersnack

Making it to the list of the top design tools for image content creation is Bannersnack. Immensely popular with social media marketing professionals and graphic designers, the online banner maker offers the following features:

  • AI-driven online banner generator: Bannersnack offers an artificial intelligence-driven online banner generator that allows users to edit multiple advertisement banners thereby reducing the turnaround time greatly and also augmenting the ease of creating banners with just a few clicks.
  • Diverse banner sizes: The online banner design tool allows the user the option to choose from a wide array of banner templates of diverse sizes including miniature versions as well as scalable ones.
  • Design from scratch with templates: Users get to choose from a wide diversity of animated and static banner themes and build their online banner the way they want to. Bannersnack allows for the use of built-in standardized themes as well as complete customization of designs.
  • Export or embed your banners to any display advertising platform: Bannersnack allows users to create online advertisement banners of dimensions that are accepted by major digital advertisement publishing platforms like Google Ads, Display Network, AdRoll, and ReTargeter.
  • Thirty-two, 32 ready-made animation presets for a fast result: Bannersnack offers users 32 built-in animation themes that can be used to create and customize animations in HTML5 through an intuitive virtual interface.
  • Create more banners of more than 20 different sizes: With Bannersnack, users get to create online banners of more than 20 different sizes at the same time, thus augmenting productivity and speed and reducing the turnaround time.
  • Allows multiple users to collaborate on any design project: Bannersnack offers some handy features for collaboration and co-creation of online ad banner copies. It allows multiple users to collaborate on the creative process of designing the banner copy.
  • Pricing: Bannersnack offers the following pricing plans for individual users and teams. Individual users can fall back on a starter trial offer of seven days for free. A monthly subscription for individual users is available for $7. A quarterly subscription of three months’ duration is available for $18 a month, and a yearly subscription for 12 months is available for $36 a month.

2. Venngage

Second on our list of online banner makers is Venngage. Offering hundreds of charts, maps, and icons to create infographics for perfect data visualization, this online banner maker is highly used for making infographics. Venngage offers the following features listed below:

  • Choose the perfect data visualization: The online banner maker offers a wide variety of options to create infographics. The list of statistical representations that can be created using Venngage includes but is not limited to the line chart, smooth line charts, area line charts, pie charts, bar charts, multi-column bar charts, stacked bar charts, scatter plot charts, bubble charts, stacked bubble charts, multi-series charts, and summary stats.
  • Customizable infographic templates and themes: Venngage offers powerful features for creation of customized infographics. The online banner maker platform provides hundreds of templates and art themes to choose from with new templates being added to their portfolio every week.
  • Easy drag and drop interface: Venggage has an easy drag and drop user interface that allows users to pull widgets directly into their canvas, lock and group widgets together into places and customize the widget size, color coding, and orientation.
  • Free-form design canvas: Yet another feature of Venngage that makes it very convenient to use and operate for non-technical people is its supremely easy navigation that allows users to maneuver across diverse art themes, icons, pictures, fonts, and objects. The design tool offers a free-form design canvas that can be used to move objects around without any area restriction, snap to grid for automatic alignment, and thus delivers a seamless user experience.
  • Share seamlessly on social media: Given that digital marketers, graphic designers and content creators usually do have the need to share their creative banners on social media platforms, blogs, and other digital publishing platforms, Venngage makes it easy for users to do so. The online banner maker tool allows users to share seamlessly on diverse social media platforms.
  • Pricing: Venngage is affordable. For business enterprises, Venngage offers subscription plans priced at $49 a month. On the other hand, premium individual subscriptions are priced at $19 per month.

3. Visme

Third on the list of the best visual content creation tools is the online banner maker from Visme. The online banner maker is highly popular among graphic designers and marketing professionals. It offers a host of features, functionalities, and end user benefits as listed below:

  • Easy to use banner maker: With a supremely easy to navigate user interface, Visme rates high among visual content creation tools for social media marketing among marketing professionals and graphic designers.
  • Hundreds of templates to choose from: The design tool also offers features of built-in images and icons to select from millions of free and high-quality photos that can be searched from the image bank along with custom graphics and fonts for the text content.
  • Create unified banners with simple resizing options: Yet another feature that makes Visme highly popular among communities of professional and novice designers is the rich customization that it offers. Users can create unified banners with diverse resizing options for their web arts and digital creatives without having to bother about the pixel clarity being affected.
  • Easily create web graphics of all sizes: Visme allows users to create graphic arts of different sizes. Right from small scale banners to the large scale ones that brands need for their social media assets in the background or cover sections, users get to create web graphics of all sizes. Thus, it ranks high on the rich diversity of scale that it offers.
  • Customize the banner template with your own graphics and fonts: Visme is one of the most popular image creation tools equipped with features like hundreds of templates for all the main social media platforms like Facebook, Twitter, YouTube, and LinkedIn. It provides custom features to choose from all types of banners, from advertisements and blogs to social media graphics of all sizes.
  • Pricing: Visme offers a three-tiered subscription plan. There is a no-frills plan with basic features for users that is free of cost. Second, there is a standard subscription plan that costs $14 per month, and a complete subscription plan that costs $25 per month that allows users to access the whole suite of features and functionalities.

4. Fotor

Fourth on our list of the top visual content creation tools for use in social media campaigns is Fotor. With probably one of the most diverse and widest arrays of templates for creating image content, Fotor offers great multi-purpose functionality that embraces both the online and onsite business ecosystems. Fotor offers the following features to users:

  • Templates: Fotor is an online image creation tool that offers a wide portfolio of templates that can be used to design web graphics and digital banners for social media platforms, emails, banners, flyers, invitation cards, business cards, thumbnails, tickets, mobile wallpapers, postcards, letterheads, and certificates.
  • Design: On the front of the design, Fotor offers a multitude of features for graphic design, photomontage, and background. The online banner maker allows users to save their work in progress on the cloud and retrieve their last work at ease to take it forward later. The design features also include support for a large number of formats including JPG, PNG, and PDF.
  • Basic edits: Fotor offers extensive features to users for executing basic edits to their copies of advertisement banners. Users can crop, resize, and straighten their web graphics with ease. Yet another feature that adds to the list of end-user benefits offered by this online banner maker is the supremely easy user interface that allows for seamless navigation.
  • AI-driven visual effects: The online banner maker also offers an option to upgrade to a paid subscription that offers additional benefits of premium content with no watermark that is free of restrictions, advanced features for ease of use, advertisement-free editing, bigger sizes of canvas, and massive cloud-installed memory to archive your finished graphics and work in progress that can be downloaded in different image and PDF file formats. AI photo effects, stickers, collage, text, HDR photography are all part of the console.
  • Multi-lingual collaboration: Further the online banner maker also offers a multi-lingual front end for graphic designers covering major international languages like Portuguese, German, Russian, French, Traditional, Simplified Chinese, and Japanese making it easy for multi-ethnic and cosmopolitan teams of designers to collaborate and co-create graphics for brands.
  • Pricing: Fotor offers two subscription plans. Users can opt for a monthly subscription plan at $8.99 per month. On the other hand, Fotor also offers an annual subscription plan at $39.99 per annum, which essentially comes down to $3.33 per month, which by all accounts is certainly affordable.

5. My Banner Maker

Fifth in our list of the best visual content creation tools is My Banner Maker. An easy to use online banner maker, My Banner Maker stands out in the list for its professional turnkey assistance and professional collaboration in addition to the technology suite that it offers. Some of the major features that My Banner Maker offers are as follows:

  • Social media banners for Facebook, Twitter, LinkedIn, and YouTube: The specialty of My Banner Maker lies in the features and functionalities that it offers for visual content to be deployed in games, that is in addition to that for social media platforms like Facebook, Twitter, LinkedIn, and Pinterest.
  • Banner advertisements of diverse sizes: My Banner Maker is one of those free visual content creation tools with simply awesome templates for feature-rich designs, custom color codes, customizable font sizes for content to go along with, and seamless user experience for designers. Further, the platform offers great scalability to users with options to access graphic content and images of different sizes.
  • Professional collaboration with the vendor: With a paid subscription plan, brands can also collaborate with the design team at My Banner Maker to co-create their custom graphics assets and visual content pieces by sharing their brand logos, brand copyrighted images, and mascots.
  • Pricing: Priced at $4. 95 per month, My Banner Maker allows users to make pixel perfect banners of different sizes, use the express banner editor and online design studio along with unlimited access to full photoshop library, and priority support.

In the final diagnosis, it is only humble to take cognizance of the ever-increasing influence of visual content in the context of social media campaigns and the opportunities that brands can look forward to leveraging. While this list is by no means exhaustive and exclusive, the above mentioned visual content creation tools make it to our list on parameters of user experience, custom design abilities, and pluralism of deployment across digital platforms. Here is wishing your brand all the luck to reinvent the future of social media marketing by creating some stunning visuals this year.

Birbahadur Singh Kathayat is an Entrepreneur, internet marketer and Co-founder of Lbswebsoft. He can be found on Twitter .

Related reading

Backlinks vs social shares How to make your content rank for different SEO metrics

Eight shortcuts for finding long tail keywords and how to use them

How to dominate Google News search in 2019

Conversation Mapping

It’s about teams: How Autodesk boosted conversions, retention and trimmed its sales cycle

Saira Nazir, head of digital marketing at Autodesk, speaking at MarTech West 2019.

SAN JOSE, CA — Why digitally transform? Business must go through digital transformation to win share, gain efficiency, make better decisions and delight customers, said Saira Nazir, head of digital marketing at Autodesk, at MarTech Conference Thursday.

Nazir outlined three foundations of digital transformation: organizational design, data and tools and discussed how Autodesk has engaged in digital transformation to move beyond incremental KPI improvements.

Organizations must evolve. “Organizational design is probably the most overlooked” of the three said Nazir. “If you update all your tools but your teams are still relating to each other and working in the same way, you will not be able to truly take advantage of the tools.”

The approach — decentralized or centralized — doesn’t matter, the key is to focus on the evolution of your teams while going through digital transformation, she said.

More insights from the MarTech Conference

Identify bad data. Often marketers get hung up on data gaps, but Nazir cautions that identifying bad data or metrics is critical to the process of creating effective data models and algorithmic outcomes. It’s just as important to identify and tag good metrics such as conversion rates, latency, pages to conversion, etc. as it is to identify and tag bad metrics that will pollute data models, said Nazir.

“As more companies adopt AI, bad data matters a lot,” she said. If you create a model, you need to tag good and bad data to help the machines learn and create a good algorithm. It’s not just identifying gaps in data but tagging bad groups of data.

A bad metric is “a lagging indicator instead of a leading indicator,” said Nazir. “That can prompt you go in a wrong direction.”

Scale with a CDP. To analyze and test at scale, Autodesk deployed a customer data platform (CDP).

The team saw that a large percentage of customers were spilling out of renewals and coming back in to the journey to find new pricing. “About 60% of traffic was leakage from renewals,” said Nazir. “They are already customers, and a CDP can identify them and create a much more tailored experience for those people that already have the product. We can give them tutorials to understand the tool better.” Identifying and specifically addressing the needs of these audiences increases retention.

The team used the CDP to map out the customer journey using Adobe IDs, purchase history and product attributes to understand how customers interacted with them. It then can identify appropriate audiences for tailored email campaigns based on if/and statements that direct users to specific content based on their engagements — at scale.

Chatbot to shorten sales cycle. Autodesk had 68-day purchase cycle. It wanted to shorten it and grow the percentage of people who buy online. The company looked at chatbot offerings to help surface tailored content recommendations to site visitors.

Autodesk ended up creating its own chatbot rooted in machine learning and programmed it using popular content. It ingests the referral data and answers from a couple of  clarifying questions at the beginning of each session before showing content links specific to the user’s needs. Autodesk also thought carefully about the look of the chatbot’s prompts, designing it to feel familiar with the look of Instagram questions.

“We predicted customers need more information,” said Nazir. “This pushes content to them sooner.”

The initiative drove 4x more conversions and 109% more time on page, said Nazir. More impressive, Autodesk didn’t test this effort on brand keywords, but only on traffic coming in on non-brand keywords.

This story first appeared on MarTech Today. For more on marketing technology, click here.


About The Author

Ginny Marvin is Third Door Media’s Editor-in-Chief, managing day-to-day editorial operations across all of our publications. Ginny writes about paid online marketing topics including paid search, paid social, display and retargeting for Search Engine Land, Marketing Land and MarTech Today. With more than 15 years of marketing experience, she has held both in-house and agency management positions. She can be found on Twitter as @ginnymarvin.

Doing backlink building like a ninja: Six best techniques

Doing backlink building like a ninja

As SEOs we know outreach for backlinks has to be done in order to give the websites we are working on the backlink authority it needs. With backlinks being one of the top three ranking factors (depending on which study you’re reading) there is definite value in doing outreach.

Although this is made a lot harder thanks to the mysterious world of black hat SEO. Webmasters out there are savvier to the tactics of sending a generic feeling email, and on our part, it’s a lot of work for usually not much return.

This is why I’ve collated a list of some of the ninja backlink outreach tactics I’ve found which work great for most sites. At the heart of most of these techniques is some good exciting content to make your website stand out, as backlinks and content work hand in hand.

So let’s get going and earn our black belt in building backlinks. (Apologies, there will be a few more bad ninja related jokes in this post.)

Six of the best ways to build backlinks

1. Sponsoring a college or university team

Ok so before we get into this first one it does involve a bit of money on yours or your clients part to get the backlink. Although this would usually cost a few hundred pounds to sponsor the team and all you’re asking in return is a backlink from their team page which hopefully if you’ve done the research right will be on a .ac.uk or .edu domain which will naturally have high authority.

2. Skyscraper technique

This one is borrowed from Brian Dean from Backlinko, and you can get more details from him on this here. In essence, this approach involves finding the top piece of ranking linkable content you can find for a search term you’re trying to rank for. Then you build on that idea to make a better version of the piece and reach out to the right people to gain the right exposure.

If someone has created content on the “best top 10 ways to be a ninja” you can go and make a post of the “top 11 ways to be a ninja”. It is key to this technique to make sure that you find the right area and do the correct research, so if you’re working on behalf of a client get their input then do your own research to back up their knowledge.

3. Interview with someone on your website

Yes, this is a way to get backlinks by doing the bulk of the work on your own website. Find an influential person in your industry and convince them to give you an interview for your website. Unless you’re running a website all about celebs, most people within any industry will be flattered that you would want to interview them.

The only stipulation to this is that they will need to have some type of following on social media. This is as it will be as much in their interest to share the content as yours. So once you have the interview share it with your PR and social team, and allow them to share the piece as much as they can, hopefully, you will get some valuable industry related backlinks from this.

4. Create a free tool

Free tools are a great way to gain backlinks, all you have to do is look at the SEO industry for this and find “top free SEO tools” posts to see a list of free tools, some of which have only been created to build authoritative backlinks naturally. These do not need to be anything fancy only something that serves the user. For examples, a mortgage broker creating a mortgage calculator is a simple solution to get targeted traffic on their site and gain backlinks from sites related to mortgages.

5. Create your own data

There is a lot to be said about the impact of data and how this can be used to gain backlinks. Although, what if you have no interesting data you can share to get out into the news? Well, there are ways you can create your own data. There are great sites like Google Surveys where you can ask a set questions to a specified number of people and get back true related data based on your own parameters.

Although — it is what you do with data that counts in gaining backlinks for this technique, once you have completed the post on your website with a snappy clickbait headline. Head over to Reddit and find the most relevant subreddits you can and post your content anonymously to see if it gets picked up. In case it fails to get picked up by any sites, get on Twitter and start contacting local and industry press journalists. Soon enough someone will pick it up.

6. Video transcripts

So this final technique takes its inspiration from Moz’s whiteboard Fridays we all know and love. On every video, it is accompanied by a transcript of the video. As Moz knows, Google finds it very difficult to understand the context of videos, so they provide HTML text that gives a much clearer indicator to Google. This makes their life much easier.

How can you use this to your advantage exactly? Well, all you have to do is find some recent video content from an expert or influencer in your field. Check their site to see if the content is accompanied with a transcript of the video, if not then jackpot! From there create a transcript for the video which is on your own or client’s website.

The last steps involve a quick buttering up of the influencer on Twitter. It could be something along the lines of “Loved the last video, you’re amazing. I have created a transcript for the video if it is useful for anyone, the link is here.” Hopefully, they’ll give a retweet and with the shares of their content comes some shares and backlinks for you.

Conclusion

Hope the whole ninja theme wasn’t too cringy. The main point is that, yes link building is much harder than it used to be a few years ago. And everyone is so tuned out to an email asking for a backlink that they’re just going to ignore them. Still, backlink building can be done. Just think outside the box, be a bit sneaky like a ninja, get creative, and make the best quality content you can for your users.

Mark Osborne is the SEO Manager at Blue Array, with a passion for keeping up to date on the latest goings-on in the SEO world. He can be found on Twitter @MarkSEOsborne.

For more on backlinks, read:

Related reading

Google featured snippet - A short guide for 2019

Five ways to improve your website's bounce rate (and why you should)

Debunked Nine link building myths you should ignore in 2019

social media_does it affect seo