Last week, we hosted another happy hour here at our New York office. This one was titled “Energizing Ecommerce: Retail winners, losers, and Amazon,” and was created in collaboration with Jumpshot. Here are highlights from the event around Amazon and Google, and their market shares in ecommerce.

Our speaker for the evening was Steve Kraus, Jumpshot’s Head of Digital Insights. Steve has been at Jumpshot since November 2018, and previously held roles including Chief of Insights at SimilarWeb and SVP and Chief Insights Officer at Ipsos. He did a PhD at Harvard in social psychology, and was also previously a professor.
He pulled on their data on consumer digital behavior to ask and answer various questions we all have about how consumers are searching and spending online.
Since they work with mostly clickstream data, the numbers in this article refer to desktop and mobile clicks, but exclude in-app actions. (You can read more about their data near the bottom of this article.)
What is Amazon’s market share of US digital transactions?
Steve jumped right in with a question we likely all have asked at one point: How much does Amazon matter in digital transactions?
Many in the audience guessed around a 35-60% share. But in reality, the distribution looks like this:
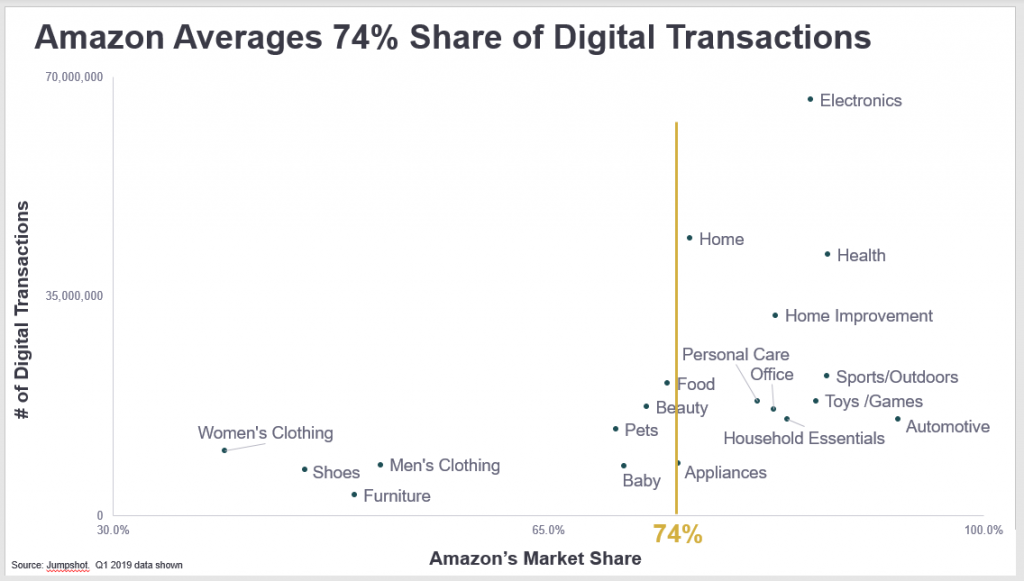
Amazon averages a 74% share of digital transactions in the US.
On this graph, the Y-axis represents the number of digital transactions and the X-axis shows Amazon’s market share in each. So for a category like electronics, you can see that there is a huge volume of digital transactions, and that Amazon holds maybe 80-85% of that volume. For something like women’s clothing, on the other other hand, both the volume is smaller and Amazon’s market share is smaller — closer to 35% (which we’ll expand on later).
Steve mentioned that it’s quite hard to capture every interaction in the long tail, but the numbers are still a fairly accurate representation of the overall.
The key takeaway?
“Everyone says Amazon is so big, but in reality many of us still underestimate them.”
According to Steve, people maybe aren’t over-hyping Amazon’s dominance (nor Google’s). And they may even be underestimating it.
“Many people guess Amazon’s market share at around 40-50% — but that’s how they perform in their worst categories, like clothing and furniture.”
He expanded on this point, adding that Amazon has 16x the number of transactions of Walmart, and 54x the number of transactions of Target.
“Even though we hear so much in the news about antitrust, Congressional hearings, etc., we still underestimate how big and powerful [these tech giants] really are.”
What percent of searches happen on Google?
Another very popular question: How much of the search market does Google own?
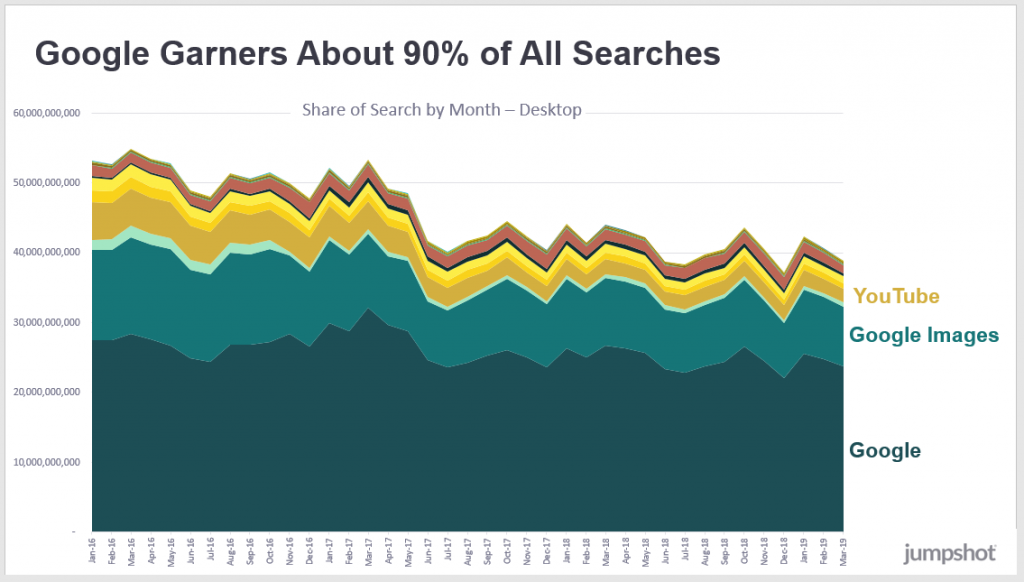
According to Jumpshot’s clickstream data, Google has about 90% of all web searches (desktop and Android phones).
The huge caveat here is that they can’t look at searches that happen via voice search nor inside an app — YouTube, Google Maps, Amazon and others all likely have huge volumes of search activity that’s not factored in. In the below graph, for instance, YouTube appears much smaller than Google Images, and we would assume that’s at least partly because most Google Image searchers use desktop and most YouTube searchers use the app.
We can also see from this graph how overall since January 2016, the volume of desktop searches is declining in all areas (and we would assume that volume is moving to mobile).
This graph shows the same data as above, but with Google removed so that we have a better view of the smaller players.
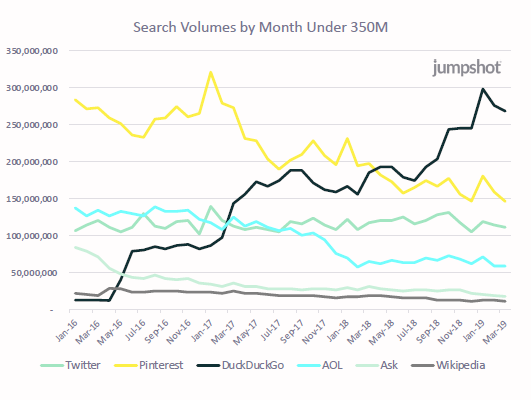
One interesting point to note here is how much DuckDuckGo is climbing. However, their overall volume remains quite small. They’ve gone from next to nothing up to 300 million searches a month, which is great. But compared to Google’s 60 billion searches a month, they hit just 0.5% of the volume.
What percent of product-related search is on Amazon?
We’ve seen that Google owns the largest share of the search market. But what if we look specifically at product-related search?
Jumpshot found that the positions of Amazon and Google flipped between 2015 and 2018. As shown in the image below, in 2015, Google had 54% of product-related search and Amazon had 46%. In 2018, Amazon had jumped to 54% and Google had fallen to 46%.
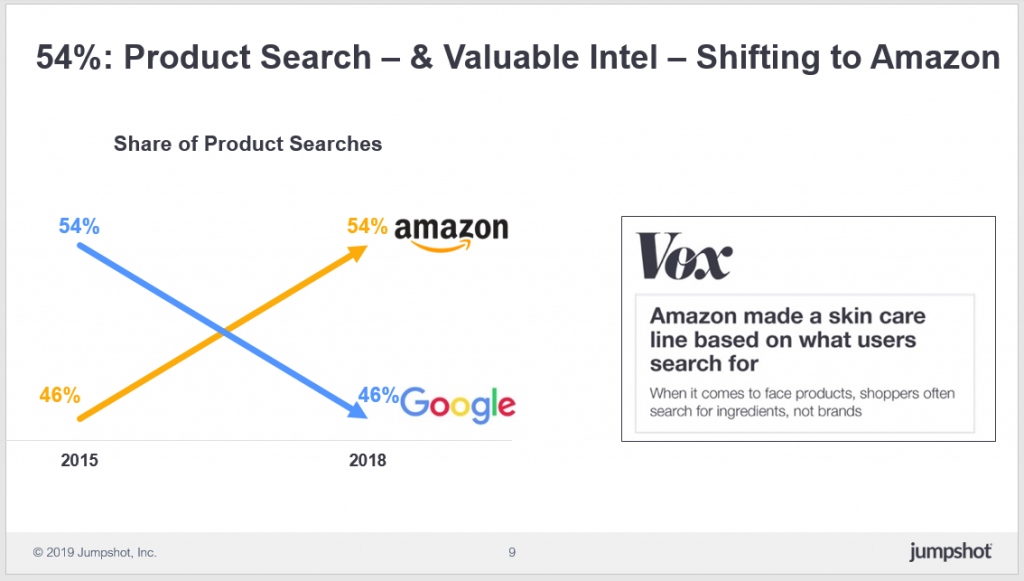
The obvious concern here, and one that Steve demonstrated via the Vox headline, is the advantage that Amazon has from all the data collected in those searches. And of course, how little of that data is shared with sellers on Amazon who are made to compete with Amazon’s own product lines.
By simply investigating “What kinds of keywords are people searching for and not converting on?”, Amazon can discover opportunities in the market and fill them in a way their competition can’t.
The story here, “Amazon made a skin care line based on what users search for” represents an example of the qualms of many sellers, regulators, and consumers.
Which retailers are successful and which are struggling?
In the age of Amazon and Google, which retailers seem to be figuring out how to stay competitive?
Contrary to popular discourse about the “retail apocalypse,” Jumpshot says that many traditional brick-and-mortar retailers are doing quite well. Other, newer digital brands are, too — Chewy and Wayfair, for example.
In this chart, we see the distribution of a number of successful and struggling retailers. The y-axis represents the overall number of digital transactions of that brand in 2018, and the x-axis shows the change in their number of digital transactions between 2017 and 2018.
Any names shown in green, therefore, are growing their number of digital transactions. Brands in red are shrinking.
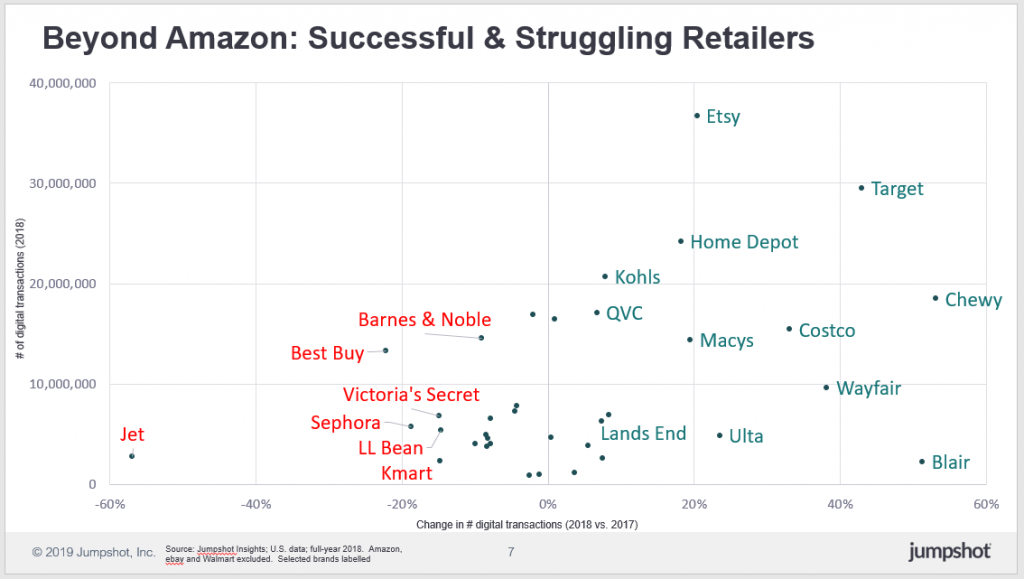
According to Steve, the retail apocalypse is a “story that’s oversold.”
On the contrary, he says that “a lot of brands known for their retail presence are figuring out omnichannel.”
What causes certain retailers to succeed while others don’t? According to Steve, part of the reason can be traced to the type of search happening: branded versus utilitarian.
Branded vs. utilitarian searches
There are two very different types of searches happening in the world, says Steve.
- Branded searches, for the name of a particular brand such as Nike, Bose, or Nintendo
- Utilitarian or unbranded searches, for items such as “phone case,” “mens socks,” and “paper towels”
And as we might expect, Google and Amazon have very distinct roles in these two types of searches. In the graph below, we see search volumes for the top 1000 branded and non-branded keywords. Google’s volume lies on the y-axis and Amazon’s on the x-axis. Items in blue are branded searches, items in orange are unbranded searches.
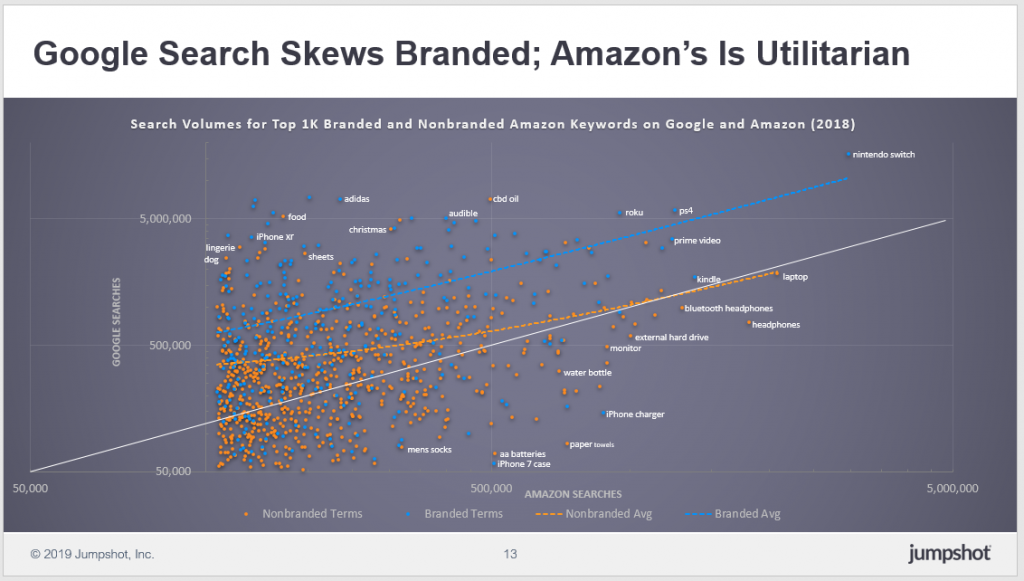
Interestingly, both Prime Video and Audible get more search volume on Google than on Amazon (despite the fact that they’re owned by Amazon).
Terms like bluetooth headphones, hard drives, paper towels, and phone cases get very good volumes on both Amazon and Google.
Noteworthy here is that it’s difficult to distinguish whether or not some of these terms are product-related or knowledge-related. If someone searches for “iphone,” do they want to buy an iPhone, learn about the next iPhone to be released, or get help with the one they already have?
Steve also pointed out that furniture is another interesting category. Wayfair has had so much success in gaining search market share there. But a few years ago, we might have predicted it would be a category Amazon could have dominated: big ticket items where people don’t have strong brand preferences. Surprisingly, Amazon hasn’t done as well there.
If we look specifically at apparel searches, we see they too tend to fall into either branded or utilitarian.
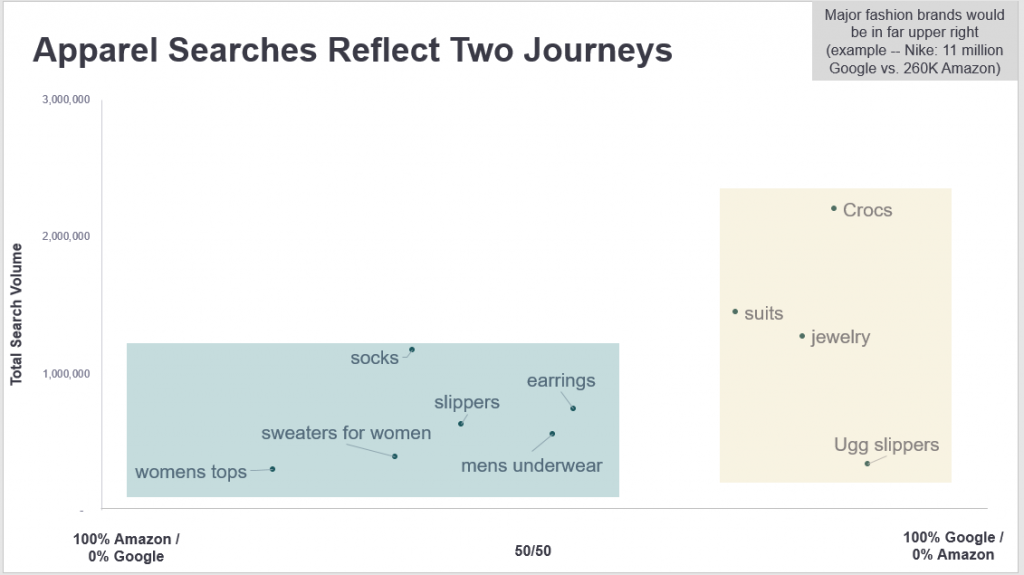
Amazon tends to do well on unbranded products like socks and underwear. Heinz for example might be highly successful on Amazon. Bigger, more well-known brands, on the other hand, tend to see higher traffic on Google.
In the image below, Jumpshot has noted that “major fashion brands would be in the far upper right.” For example, they say Nike has 11 million searches on Google versus just 250k on Amazon.
To be competitive in this context, Steve says one might ask themselves:
“What search terms are growing and not converting? That’s the real sweet spot of opportunity.”
Share this article
Related articles
Organic clicks, paid clicks, and zero clicks
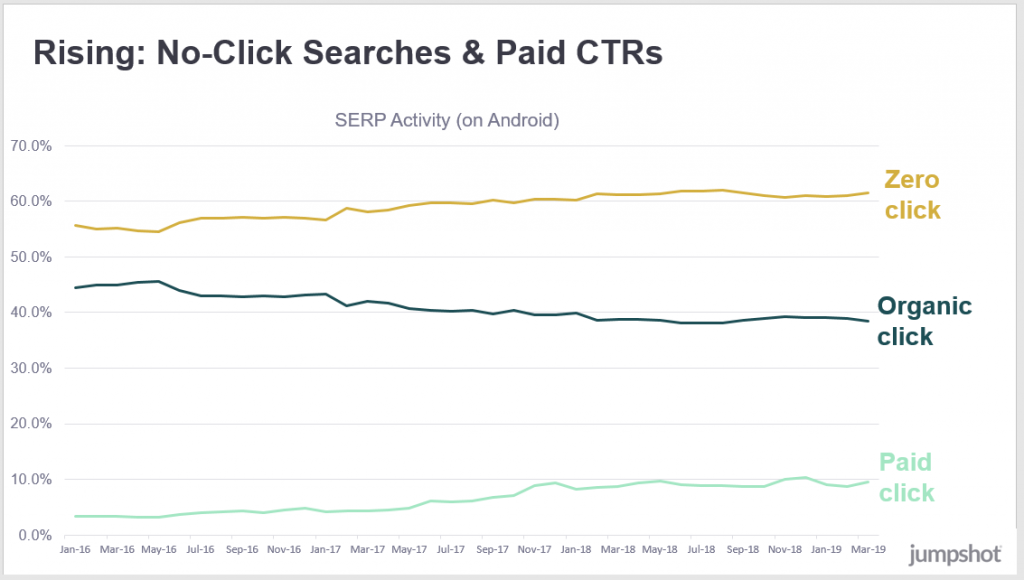
There are three possible actions after a search: organic clicks, paid clicks, or zero clicks.
Another question many of us are asking is, “Which of these, if any, is on the rise?”
In the graph below, we see trends of types of clicks from January 2016 to March 2019. Paid clicks and zero clicks are going up, and organic clicks are going down.
And of course, the whole idea of zero-click searches has a lot of people raising questions.
- What percent of searches on Google result in no click?
- How many people now find what they need from the home page?
- What does it mean for the publishing industry if the content a business creates can provide information to a user without that user ever leaving Google’s site?
- How much more crowded and informative will SERPs become?
Similarly to Amazon, Google has extremely valuable data about searches. It’s arguably in their own business interest not to share it.
How do people go about finding things online?
Discover –> search –> shop –> buy.
In this image, Jumpshot shows the consumer funnel and how Google and Amazon play dominant roles in the search and shop phases. Of the “search” category, Google has close to 90% of total search volume and Amazon has about 54% of product search volume. Of the “shop” category, Amazon has about a 75% share of transactions across categories.
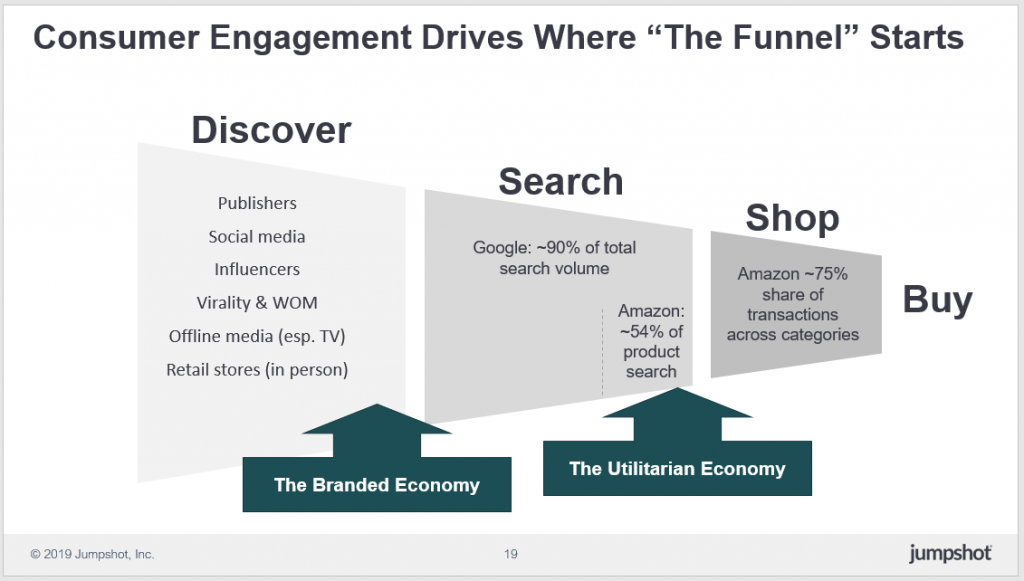
Interestingly, though, the upper part of the funnel remains a bit more up for grabs. And as Steve points out, it’s a “very hard thing to quantify. We can quantify if you’re searching or shopping, but discovery has less immediate action.”
We might assume that sites like Facebook, Instagram, and Pinterest are where most of the discovery is happening. And while Facebook perhaps used to be very strong there, they’ve made changes to de-emphasize advertisers and move toward privacy.
On regulation
At one point, an audience member asked Steve about his thoughts on regulation and privacy.
“My own suspicion is that here in the US it won’t happen anytime soon. In the EU yes, it’s already happening. But in the US, it almost seems “un-American” to talk about anti-trust. These are entrepreneurs. They made their own success. Why would we punish them? I don’t see the political will to do that here.”
At the same time, he noted that “you do see Facebook and Google preemptively stepping back from some things to stay out of the way.”
What kind of data is Jumpshot looking at?
Jumpshot works with anonymized, aggregated, clickstream data from about 100 million devices, including desktop, mobile web for android, and app usage. (Note that their app data sits in a separate data set and doesn’t generally show what happens in an app. Rather, it shows if an app is opened, how many times it’s opened, and if a user clicked through to anything else.)
With clickstream data, Jumpshot can only look at what websites people have visited. They can model age and gender based on those websites, but overall their view is fairly high-level.
They also calibrate that data against “known sources of truth” such as actual versus predicted visits to a certain website. Based on those known sources of truth, they can develop algorithms to calibrate their numbers to those actual known numbers.
In general, Steve mentioned, their data is most accurate where they have more known sources of truth (such as in the US market).
“When Google and Amazon are so dominant, what does that mean for brands?”
We asked Steve what he found surprising or interesting about these findings, and he named: “in this world where Google and Amazon are so dominant, what does that mean for brands? How do they thrive? How do they make decision of utilitarian vs branded economy? They have to decide which one they’re going to play in. Some brands are strong enough that they’re able to do both.”
He elaborated with the example of Nike. They came out a couple years ago with a high-profile announcement that they would start selling directly on Amazon, which they hadn’t done previously.
Even if a brand isn’t directly selling on Amazon, the likely scenario is that they still have a presence there. Consumers can still go to Amazon, search for Nike, and get served results from resellers and wholesalers. Products may or may not be counterfeit, and sellers may or may not provide good service.
“A brand that’s not on Amazon is basically abdicating their presence on Amazon to lesser people, to these forces of the marketplace that they have no control over,” Steve says.
Nike wanted to have control over that, so they began a complex process of figuring out what and how they were going to sell on Amazon. They obviously wanted to keep their nike.com site, and they happen to be among brands who are strong enough to do so. So they started figuring out what consumers search for on their site versus on Amazon, and what products and prices to offer on each.
For retailers, Steve says, the question is:
“Do you want to work with Amazon, through Amazon, around Amazon? How do you thrive in this digital world where so many aspects of it are these winner-take-all markets?”
Whitepapers
Related reading
There are only two broad strategies to improve your link building effectiveness, both of which come from a framework using BJ Fogg’s behavior model.
An in-depth guide to call tracking technology that reviews how these tools help marketers connect digital campaign data to inbound customer phone calls.
Five extensions that directly complement on-page SEO strategy, help rack-up rankings, track your website’s performance, and measure the core online metrics.
It’s key to focus on one or two tests to ensure you reach statistical significance. Guide to testing ad copy, landing pages, new engines and ad formats.

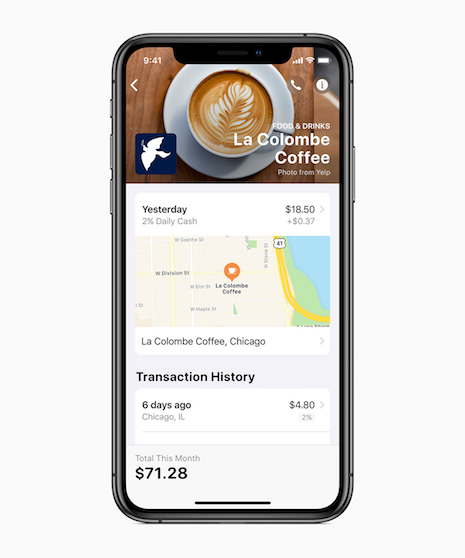
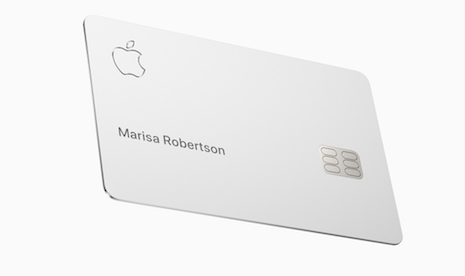
 Apple Card is primarily designed to function as a mobile payment option. Image courtesy of Apple