Contextual audience targeting: Pivot your audience strategy from cookies to content

The 2018 European Union’s General Data Protection Regulation, or GDPR, started the snowball of data tracking and privacy regulation in the United States, all but killing off what we know as behavioral “audience-based” targeting. However, these regulatory headwinds empower content creators and publishers to bring new, innovative targeting strategies to their advertisers.

Content creators can offer GDPR-safe “contextually based audience targeting” to advertisers as an alternative to traditional cookie-based behavioral targeting. But first, let’s be clear about a few things.

Change your assumptions: Consumers don’t want ads

Behavioral targeting, coupled with RTB and programmatic technology, has given marketers a false reality: they assume users want to see their ads and offers. In reality, does a narrowly focused, self-serving message break through the noise to make a consumer’s life better? Usually, no. Sorry to break the news, but consumers don’t want ads: Ads have become more common, frequent, annoying, irrelevant and intrusive.

Not only do users not want to see your ads, over 40 percent of users think following them around the web has become too aggressive. It’s viewed as a breach of privacy. As the supply of advertising increased, so did tracking and data usage. “Audience targeting” was first called “behavioral profiling,” until it was thought that it sounded too invasive. In the interest of self-regulation, the practice was relabeled “interest-based advertising.”

But regardless of the shade of lipstick, consumers have taken note and voted: they block ads, by the millions. As of 2019 in the U.S. alone, over 75 million — or 26.4% of internet users — enable ad blockers.

Consumers want content (it is king, again)

Content takes many forms, offering consumers numerous choices like digital, print, audio, video, mobile, home, work and even in the car. Marketers once considered 500 cable channels fragmented. The internet has redefined media fragmentation, transforming consumer niches into mass markets. Journalism, once reserved for professionals, is now decentralized and social. Your friends are authors. The traditional model of advertising is at the bottom of most users’ content value chain.

If an advertiser’s message is accurate, informative, simple, entertaining and interactive – then it might be considered great content. But most ads are traditional and don’t meet these criteria. Consumers are embracing personalized, timely, value-added content from brands. However, the challenge for these “personal” formats is making content relevant at scale while avoiding burdensome personalization costs. But when content marketing works, it drives returns like an annuitygenerating ROI well beyond the date of investment. As publishers know, good content takes time and work.

Content creators own the customer

In a world where content is king, the publisher owns the user relationship, not the advertiser. While, in some cases, it may be ideal for publishers to engage in a “consent” campaign on an advertiser’s behalf, it’s unlikely that publishers are willing to “sell” their users that easily. After all, publishers want users to return, cultivating a deeper relationship based on content quality and trust. Publishers can then sell “access” for advertisers to engage with users (aka advertising).

Pivot your audience strategy from cookies to content

The entire ad tech ecosystem has been built around the user and the cookie. Attribution is no longer possible as we know it. Upper funnel prospects are unknown. There’s no way to track, measure, or profile them.

Cookies, device IDs, emails and other personal identifiers are ideal when you directly own the customer relationship. Advertisers know their customers and what they buy. Advertisers can reach out to customers directly or through retargeting. Customers want a relationship with advertisers because the advertiser brings value.

For anonymous users and prospects, advertiser’s have limited visibility without an opt-in. But publishers know their reader and how users consume content. Publishers have perfect visibility into their website. Under GDPR, a publisher’s URL is the new anonymous identifier.

The customer continuum

Advertising has been used by marketers to drive upper funnel metrics, like purchase intent and brand awareness. Advertising is also used to push prospects into the CRM sales funnel.  Customer relationship management (CRM) is typically a business-to-business or consumer-direct marketing strategy. After the top funnel impression, conversion and retention are often managed by a different team, department or agency. This practice will soon become ineffective, requiring a unification around the customer lifecycle, top to bottom.

Profile URL, not cookie

Consider profiling around a URL (content) and not a cookie (user). This might be an awkward new concept to embrace since URLs aren’t thought of as identifiers for prospects or customers. But until an advertiser gets user consent, a publisher’s content URL is the only GDPR-compliant identifier an advertiser has to understand anonymous, top-of-funnel user behavior.

Using something I call a “contextual audience” strategy relies on cooperation from publishers for “profiling” content that can be used by advertisers as an alternative to behavioral audience segments. This means that publisher content taxonomies must, therefore, be deeper and more transparent than ever before.

Here are four key steps publishers and advertisers need to take for executing the alternative to cookie-based behavioral targeting.

1. Align acquisition and retention as part of a single customer continuum

With GDPR’s required consent, advertiser’s have some insight into their customers for traditional behavioral audience targeting. Typically, these are not the users presenting a challenge under GDPR or the forthcoming CCPA. It’s the remaining majority of users in the top and middle of an advertiser’s funnel who present challenges for cookie-based behavioral targeting. These anonymous warm leads are the users consuming content where publishers have a close relationship to bridge value with advertisers. If publishers manage their users, data and ad sales holistically, publishers have an easier path to embracing contextual as a practical means for delivering audience targeting to advertisers.

2. Create contextual audience profiling segments

Most advertisers still think advanced user level insight is only possible with cookies. But contextual data, when planned for and managed, can be a powerful signal for traditional user behavior – all without GDPR risks. However, keep in mind where cookie-based data signals are a mix of explicit and implicit data, contextual audience profiling is exclusively inference-based.

Contextual classification services provide categorical taxonomies as a basis for insight. Pages, apps, videos or an entire site are classified into one or several categories from a list of hundreds. Often the category comes with a weighting of confidence in the match.

With a different interpretation, contextual taxonomies become a technique for understanding user interests. Interests are perennial activities for a given user – hobbies, professions or even fleeting casual thoughts. It’s only when a user’s activity takes a sudden spike or trend within an interest that they show intent. For example, if someone browses travel content over weeks or months, they may only aspire to travel. When the frequency of this activity becomes more time compressed, focused (e.g., a specific hotel in a specific location) or coupled with other bottom funnel signals (like search), user-based cookie data providers classify the user as having “travel intent.”

The same interest to intent methodology can apply to anonymous and GDPR-compliant contextual audience profiling with content. Interest becomes intent when, and how, you apply an additional signal to the contextual category of interest. The secret to identifying intent is an analysis of the page type or specific intent keywords within the content. For example, shopping cart and booking page visitors are bottom funnel in-market intenders. But only when you couple the page category (e.g., hotels) with high-intent keywords (like “where can I buy,” “coupon code,” “free shipping,” or any word combined with price like “best price” or “low price”) will you identify URLs which signal intent. With some contextual providers, you can predefine these URL+keyword combinations as custom categories within your taxonomy.

Compare the potential scale and precision of a contextual audience technique to traditional cookie-based audience segmentation:

  • 14 third party cookie-based interest data providers offer 17 to 6,000 basic interest segments.
  • Five of these 14 data sellers offer a travel interest or intent segment for a total of 170 unique traits.
  • Using the contextual audience technique joining 27 IAB travel categories with the five intent keywords mentioned above, you create 135 unique travel intent segments.

The more intent keywords you define, the more intent segments you can create. As an added layer of insight, analysis or segmentation, consider applying a layer of sentiment, emotion or entity identification to each URL from specialized content analysis services.

Like any user-based cookie segmentation method, you’ll need to experiment with categories and keywords to understand the optimal combination of content that yields stronger advertiser intent than audience or channel targeting.

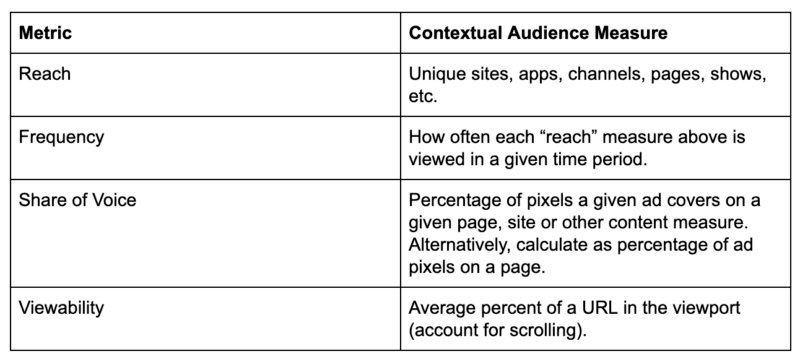
3. Define your contextual audience metrics

Cookie-based targeting has many user-based data points to measure and analyze, like pages viewed, time spent, hover or engagement time, clicks, and conversions. Some fundamentals of media, like reach and frequency controls, are inherently user-based optimization metrics. Finding proxies may be difficult, but it’s not impossible. Consider the media metrics below and how to use them in your contextual targeting framework:

Apply these metrics to unique URLs you’ve classified with interest and intent signals (category + keyword) to begin formulating and analyzing your contextual audience targeting products.

4. Extend contextual audience targeting to ‘look-alikes’

As you begin implementing the contextual audience profiling and targeting methodology, you will start broad and may appear inefficient. To accelerate optimization, publishers should consider extending their content data to the advertiser for look-alike modeling. Advertisers can analyze URL consumption behavior patterns of content with the advertiser’s opted-in users (these are the users who have explicitly told advertisers it’s okay to track, measure or monitor them under GDPR). By co-passing URL metadata from publisher to the advertiser, advertisers can perform a typical user conversion path analysis of their opted-in users, identifying a publisher’s content URLs that drive to the advertiser’s desired conversion event. Advertiser’s can then “heavy up” spending for these URLs on a site, app or other content.

For example, if the advertiser goal is to sell travel bookings, an advertiser will look at the URL consumption patterns of customers who have purchased in the past. First, the advertiser will discover which URLs drive users into GDPR consent before purchase (if any). Then the advertiser will identify the URLs along the path to conversion that appears most prevalent. Consider sharing the metrics in step four with advertisers as part of the analysis. These are the key metrics they’ll need to advertise and optimize against your content in the anonymous contextual world.

Advertisers should give more weight in their media plan to URLs, sites, domains, videos or apps that show a correlation with user conversions. This doesn’t require advanced data science – though that would supercharge anyone’s efforts. A spreadsheet data analyst can do this basic modeling for you.

Here’s how to address objections to the contextual audience strategy as well as some tips for success.

Research shows ads-as-content works

Back in the day, some pages within newspapers and magazines would attempt to look very similar to the content, but not exactly. This “advertorial” was an ad in disguise. Fast-forward a few decades and a similar approach has been taken by “native” advertising.  This ad format looks less like a “hard sell” and more like information related to the content being targeted. More recently, content marketing replaces what we consider an “ad” with content and it works. The idea remains the same – make the ad look like the content. In a broader context, it’s simply personalizing the advertiser’s messaging. Even going back to the dawn of digital advertising, research studies show that contextually relevant messaging is highly effective, whether it be the message itself or integrating elements of your content’s UI.

Accurate targeting is a myth

It may be difficult for some to break their traditional thinking and wrap their head around something so radical like contextual audience targeting. They will likely question the accuracy of this “targeting” approach and dismiss it as nothing more than traditional contextual targeting. Not only can you challenge the alternatives in the age of GDPR (such as the scale limitations of first-party data and obtaining consent), but you can point out that cookie-based behavioral intent targeting segmentation is incorrect more often than it’s spot-on [pdf]. The bar for targeting “being accurate” is low.

Frequency capping is a myth

For anyone who suggests that frequency capping with contextual audience targeting is impossible, I respond that frequency caps in the cookie world is a farce. Third-party ad servers and DSPs have imperfect measurements into the frequency of messaging across a media buy, especially within the walled gardens where data is scarce. More importantly, controlling frequency in this world is impossible due to the fragmentation across platforms, gardens, devices and data sets. The ability for anyone to control frequency within a programmatic buy is constrained to the OTT device, browser or mobile phone – there’s no universal ID to tie a user experience together across these ecosystems (especially when the user is anonymous). Compound this with the walled gardens where the frequency can only be controlled within the silo itself, independent of what you may do outside the walled garden. In the end, frequency is only controlled by who owns the user relationship, both in the cookie world and the GDPR cookieless world. Publishers own the user relationship, content and ad inventory, and have frequency cap controls over their users. Controlling frequency by unique URL gives advertisers some capping control without GDPR consent.

Contextual technology has evolved considerably

Contextual analysis has grown from general website “channel” categorization over the past several years. Computer vision has made analysis of static images and video content a complement to textual content analysis. Natural language processing (NLP) and semantic algorithms are also constantly getting better and faster. Lastly, all these are being accelerated with the help of machine learning and artificial intelligence models. Not only can you understand the topic of the content, but sentiment and even intent of the author or reader. In conclusion, what isn’t perfect today will improve over time. It certainly needs to in the GDPR age.

Publishers must step up and embrace the opportunity

There will be challenges in universal execution of a contextual audience profiling and targeting model across different publishers and content providers. A publisher’s challenge is to be more accommodating to what an advertiser needs to make the contextual audience strategy a success. After all, without cookie targeting, advertisers can no longer avoid buying publisher inventory to reach their prospective customers. Without opt-in, publishers are a critical necessity to the advertiser’s marketing funnel. It’s in a publisher’s best interest to provide more transparency, details and raw data for advertisers to profile content. Content creators who adopt this new model of advertising will lock in profitable advertiser relationships for recurring revenue.

In a world without consent, advertisers need publishers because publishers own consumer relationships at scale.


Opinions expressed in this article are those of the guest author and not necessarily Marketing Land. Staff authors are listed here.


About The Author

Keith offers 23 years of product experience in data science, devices, networks, systems integration & workflow automation, video and adtech/martech software. He applies a unique blend of lean startup principles with the scientific method in an agile framework to synthesize complex situations, articulate opportunities and instill focused discipline to deliver a product that solves a customer’s need. Keith is the inventor of four adtech patents and the founder of IPG’s Cadreon, the industry’s first agency trading desk.

On-site analytics tactics to adopt now: Heatmaps, intent analysis, and more

On-site analytics tactics to adopt now Heatmaps, intent analysis, and more

Is your landing page engaging your target customers? How can you increase ROI without increasing marketing budget? Both of these questions can be answered by a well set on-site analytics routine.

You cannot improve what you are not measuring. This makes web analytics the most important growth tactic out there.

But are we measuring enough?

Most digital marketers out there believe they are already incorporating web analytics by using Google Analytics and monitoring daily traffic sources.

While Google Analytics is a great platform, there’s much more into web analytics than using one platform (especially if you are not technical enough to make use of event tracking).

As technology is evolving, you need to always be looking for more and more ways to analyze your page performance to discover new growth opportunities and understand your target customers better.

Here are a few on-site analytics ideas for you to experiment with:

Conversion optimization analytics

These questions will lead you to stats that provide actionable insights about your page and user behavior.

Are your on-page CTAs engaging your page users?

The purpose of conversion tracking is to analyze which of your on-page calls-to-action engage your customers best.

There are several events and conversion tracking solutions out there, including the most obvious one, Google Analytics.

Further reading:

But you know that I love newer less-discussed tools that can bring an innovative perspective or method to the table.

Finteza is a free web analytics platform that focuses on monitoring and analyzing conversions. The unique feature of Finteza is its unique conversion analysis that shows how your customers are engaging with each step inside your conversion funnel.

You can track multiple calls-to-action and compare how they perform at what stage of your conversion funnel.

To use Finteza:

  • Install its tracking code (this part is similar to Google Analytics).
  • Add your events (which is much easier than Google Analytics). You can even use their plugin that lets you add links to events using WordPress visual editor.

Screenshot example of adding events in WP using the Finteza plugin

Once all your events are set-up, you can build your funnels inside the “Funnels” section by simply selecting your events to see within one report:

Screenshot example of tracking WP events using the Finteza plugin

Which page elements draw your users’ attention?

Another great way to analyze your page performance is to use heatmaps.

A heatmap is a visual color-coded representation of user behavior on your site. Here’s more in-depth information on heatmaps. There are several types of heatmaps that can help you get a more in-depth understanding of what people tend to do once they land on your page:

1. Click maps visualize which links and buttons attract most clicks. These are great to analyze whether your CTA or a banner attracts most on-page interactions (clicks).

2. Move maps visualize where desktop users move and pause their mouse. These could be used to identify parts of the page that distract your users from your main CTAs.

3. Scroll maps visualize how many people scroll down to any point on the page. This is perfect if you want to see how deep into your long-form content your readers tend to get.

You can easily set up any or all of these heatmaps to track your page using Hot Jar. To use HotJar, simply install their tracking code. From there you can set up any type of tracking for any page of yours inside HotJar dashboard.

Screenshot of Hotjar

HotJar is free unless you want to track more than 2,000 page views a day (my tests usually include 1,000 views only).

By analyzing and aggregating user behavior, heatmaps give an overview of how web page users interact with the page. This helps understand on-page engagement trends and optimize for higher conversions.

While conversion tracking tools are all about understanding what engages your users, using heatmaps will help you clearly see what distracts your page users from converting as well as what can help you draw their eyes to more important elements of your page.

For example, if they keep clicking your image instead of your CTA, or if they keep ignoring your important links (or scroll right through them), you know that you need to re-position your site elements and remove a distracting image.

On-page SEO analytics

Is your content targeting the intended audience?

Search intent is by far the most important metric out there determining how well the page meets your target customer’s needs:

  • Why do people type certain words in the search box? What do they intend to do?
  • Does your page give them what you need? Does it provide a solution?

In other words, search intent reflects the user’s intended action behind each search query. It defines whether your page has any chance to convert at all. With voice search on the rise, meeting the users’ immediate needs should be any business’s priority, which is why search intent has become a much hotter topic these days.

Both of these questions can be answered by intent analysis. Text Optimizer is the fastest way to analyze whether your page is likely to satisfy the needs of your page intended audience.

Screenshot of Text Optimizer

Text Optimizer applies semantic analysis to create a visual representation of the intended audience and whether the page is likely to meet their expectations. To install, simply copy-paste the URL of your page and the tool will do the job.

Is your web page optimized enough?

Finally, the most boring, yet still necessary page analysis tactic is to check if your page is sufficiently optimized. In many cases, when you seem to be struggling to get your page one to two positions up, on-page SEO analysis is the answer.

Serpstat’s Text Analysis feature provides a fresh perspective on how on-page analytics should be done. It determines the keywords all your more successful organic search competitors have and shows where exactly you want to include those on your page:

To use the Text Analysis feature:

  • Run your keyword list (for Serpstat to group it into thematic clusters)
  • Click through to “Text Analytics” tab and provide your landing page URL that you want to rank for each group
  • Wait for the tool to analyze the content of your top-ranking competitors and provide the list of keywords that seem to “move the needle”,  keywords that appear in most high-ranking pages for a certain query group.

Serpstat’s text analysis goes through your top ten organic competitors, compares its content and generates a list of keywords that appear on all of them. The idea behind this is actually brilliant: We don’t know why a certain page is ranking higher than your page, so whatever is able to move the needle is worth trying.

Takeaways: New analytics tools and tactics to experiment with

  • Try setting up user behavior tracking and event analytics with Finteza
  • Set up HotJar to monitor on-page engagement with heatmaps
  • Analyze whether your page satisfies search intent using Text Optimizer
  • Analyze what should be included in your on-page copy using Serpstat

In order to develop a sound digital marketing strategy, you need to know and understand your target market and how users engage with your site.

This research should be repeated at least quarterly, since markets can easily change, even in a short period of time. You may also find that you are able to expand your target market, leading to greater revenue generation, and wider reach.

On-site analytics is a continuous process. It never really ends. You need to continue analyzing and comparing your page performance and user engagement metrics to keep up with new user expectations, new traffic sources and new tactics your competitors are implementing to attract and engage customers to their sites.

Ann Smarty is the blogger and community manager at Internet Marketing Ninjas. She can be found on twitter @seosmarty.

Related reading

How to take advantage of the latest updates to Google Search Console

SEO case study - How Venngage turned search into their primary lead source

Three ideas to create a high-converting product page

Salesforce announces Pardot Business Units for enterprise marketers

Salesforce is launching Pardot Business Units, a new feature for digital marketers looking to segment audiences across different areas of an enterprise. The solution, announced Monday, aims to provide agile functionality and analytics to global marketing teams for account-based marketing efforts. The tool leverages Pardot Einstein, Salesforce’s AI, seeking to help sales and marketing teams interpret digital engagement metrics and understand what type of content effectively resonates with the individuals who compose enterprise buying teams. The AI analyzes engagement metrics from across an entire enterprise, rather than the business units, giving digital marketers access to enterprise-level data and connect with their global marketing partners to share insights.

Why we should care

Enterprise digital marketers are familiar with the challenges of operating in an environment with limited access to different parts of the business. For companies composed of sub-brands, business units and across multiple geographies, most team have their own siloed data, best practices and processes. The lack of visibility and processes can hinder teams from sharing data and aligning messaging across the organization. Pardot Business Units seeks to allow users to break down those silos.

It also addresses privacy and compliance regulations by allowing teams in different geographies to see when a customers has provided explicit permission. “Compliance is such an important part of this capability,” says Nate Skinner, Pardot vice president. “We’re focused taking care of compliance to help marketers manage it.”

More on the news

Digital marketers using Pardot can now:

  • Segment audiences by line of business, sub-brand or geography for targeting.
  • Understand what customers and leads have provided consent for marketing.
  • Create visual reports for engagement metrics across multiple domains.

About The Author

Jennifer Videtta serves as Third Door Media’s Senior Editor, covering topics from email marketing and analytics to CRM and project management. With over a decade of organizational digital marketing experience, she has overseen digital marketing operations for NHL franchises and held roles at tech companies including Salesforce, advising enterprise marketers on maximizing their martech capabilities. Jennifer formerly organized the Inbound Marketing Summit and holds a certificate in Digital Marketing Analytics from MIT Sloan School of Management.

Spotify is testing voice-enabled ads that let listeners command engagement

Spotify announced Thursday it’s testing a new voice-enabled ad experience on mobile to give listeners the ability to interact with content using voice commands.

For now, the streaming service is experimenting with the format to direct listeners to branded or original content. The initial test ads promote a branded playlist from Unilever’s Axe and Spotify Studios’ original Clash podcast.

How it works. When a voice-enabled ad is served, listeners can opt to engage with it by responding, “Play Now.” That voice command activates the playlist or podcast, which also contain additional ads. If the listener doesn’t respond or says something other than the “Play Now” command, the current audio content will resume as usual.

The ads will only be served to a subset of users in the U.S. who have microphone permissions granted in their settings and are streaming from the free, ad-supported version of Spotify. Users can opt out.

Why we should care. The new voice command format underscores Spotify’s continued efforts to build out its ad-supported streaming service and invest in voice solutions.

The formats could provide effective ways for advertisers to promote content and engage consumers when they’re not head down in their screen devices.


About The Author

Taylor Peterson is Third Door Media’s Deputy Editor, managing industry-leading coverage that informs and inspires marketers. Based in New York, Taylor brings marketing expertise grounded in creative production and agency advertising for global brands. Taylor’s editorial focus blends digital marketing and creative strategy with topics like campaign management, emerging formats, and display advertising.

Why you want ‘clumpy’ binge-buying customers

We’ve all heard of the term the “hot hand” in the context of sports. Basketball players go from missing every shot, to scoring in streaks. Sometimes players are in such a “zone” that he or she seemingly can’t miss a shot. Baseball players also tend to hit home runs in bunches.

Throughout my career and through my research at Wharton, I’ve studied the phenomenon of the “hot hand” as it relates to the way consumers tend to buy products and services or consume content. Simply put, customers who consume or buy content in bunches, then go away and come back and buy in bunches, are more valuable to companies than customers who buy at a steady pace.

Don’t believe me? Let’s take a deeper look at how measuring binge consumption by customers, or what I call “clumpiness,” can be applied to maximize Customer Lifetime Value, yielding stronger sales and marketing ROI over time.

Maximizing Customer Lifetime Value with clumpiness

CLV is universally accepted as a central tenet of marketing today. In both academia and practice, it is looked upon as a goal of firm value maximization. That is, more profitable firms recognize that CLV maximization yields greater cash flows and higher long-run profits.

Relatedly, mathematical models that allow these firms to predict CLV are commonly based on a framework commonly called RFM.

  •       Recency – How recently did a given customer make a purchase?
  •       Frequency – How often they made a purchase?
  •       Monetary Value – How much did they spend?

These are the cornerstones of CLV calculations and segmentation used by countless marketers and I’m here to tell you: They’re wrong!

Well, sort of. They are incomplete.

Through research, I have demonstrated and introduced that not only are RFM crucial components to calculating CLV; there is one additional dimension that MUST be factored in: clumpiness (C) or as some refer to it, binge consumption.

The hot hand

Let’s go back to the hot hand example and the player who is scoring points in bunches. Now, juxtapose over the world of marketing and consumers and you have clumpiness, AKA consumers who buy in bunches.

My research shows those who consume or buy content in bunches, then go away and come back and buy in bunches, are more valuable than other customers.

Let me put that another way. If a given brand knew both – how clumpy a consumer’s behavior is AND how frequently they buy – the better predictor when it comes to their future CLV is their clumpiness. I realize that may seem shocking, but it’s true. My research clearly illustrates that brands/marketers should be tracking someone’s clumpiness over time because that’s extraordinarily predictive of their CLV.

Across the board, marketers see far stronger results when they use RFMC data versus only using RFM. By focusing on clumpy consumers as their most valuable customers, brands can realize far stronger CLV and profitability.

With that overview in mind, let’s take a deeper look at what various brands have done to improve CLV and better target their marketing to encourage binge purchases by consumers.

Digital consumers behave more clumpily

We’re all familiar with binge-watching a series on Netflix, or other binge consumption of content from YouTube to gaming. But consumers have expanded this behavior beyond digital content and we’re now seeing it everywhere — from shared services such as AirBnB, Lyft and Uber to retail and online purchases.

A variety of different factors can drive clumpy behavior. In the case of content, the key driver is availability. For example, Netflix releases a new season of a given show, and suddenly everyone wants to watch it ASAP. They literally plan their lives around it.

Consumers can go weeks in between major purchases and then get the “hot hand” making multiple purchases or consuming an unusual amount of goods or services in a short period, or spending more money in a concentrated time.

The two sides of being clumpy and the demographic view

There are two types of clumpiness when it comes to consumers – visit clumpy and purchase clumpy. Consumers who are visit-clumpy are akin to the classic “window shoppers” of yesteryear. They visit both online and offline channels without necessarily making a purchase. In contrast, purchase-clumpy shoppers are far more valuable over time.

As a part of our research, we examined multiple retailers in specific product categories. Among the key findings were that millennials are more clumpy than other generations and that women are clumpier than men.

With marketers struggling to figure out how to market to millennials, this information can be helpful. By understanding clumpiness as a key facet of CLV, brands are turning the corner and seeing better results.

By understanding clumpy behavior, knowing to look for it and analyzing the level of clumpiness, marketers and other key decision makers gain a new metric for measuring and predicting CLV and choosing which customers to focus on and when. They can also gain a better understanding of customer satisfaction and react to it faster.

Defying the odds

When I first set out to conduct the research, I would have bet that the, findings would indicate that regular buyers were more loyal than those who buy in clumps. Well it turns out that my research, as well as others, suggests that regular buyers are in fact not more loyal.

Many times these are subscription customers and in fact, just buy without even thinking about their repurchase decision. A lot of research shows right now this is how you lose money. You take someone that buys in a regular pattern and try to upsell them because they don’t even think that they’re buying in a regular pattern.

We call it “poking the sleeping bear.” You poke somebody who’s just using your service regularly but isn’t even consciously … let’s say monthly making the decision to do so. And by your saying “Hey, why don’t you also buy …product?” “Holy cow! You mean I’m spending $300 a month on your product? Forget it! I cancel!” But your goal was to upsell them and instead you made them churn. So I’m not a strong believer in just observed loyalty. What appears to be observed loyalty over time, that’s not actually loyalty.

Final thoughts

I’m sure many of you reading this will have doubts. Many of you will want to stick to the tried-and-true RFM method and you are of course more than welcome to continue to do so. But I can tell you, without reservation, that if you do not begin to also factor in C (clumpiness), you will never get a true read on your customers.

Although recency/frequency/monetary value (RFM) segmentation framework, and its related probability models, remain a CLV mainstay, companies need to extend the framework to include clumpiness to predict future customer behavior successfully.

After studying thousands of data sets from companies across categories, we’ve found that C adds to the predictive power, above and beyond RFM and firm marketing action, of both the churn, incidence, and monetary value parts of CLV. Hence, we recommend a significant implementation change: from RFM to RFMC.

Measuring clumpiness has huge practical value. Clumpy consumers are worth more money and firms need to find them, and use marketing to drive customers to binge consume.


Opinions expressed in this article are those of the guest author and not necessarily Marketing Land. Staff authors are listed here.


About The Author

Eric T. Bradlow is the chairperson of Wharton’s Marketing Department, K.P. Chao professor, professor of marketing, statistics, economics and education, and co-director and co-founder of the Wharton Customer Analytics Initiative. He is also the co-founder of GBH Insights, a leading marketing strategy, consumer behavior and analytics consultancy. He has won numerous teaching awards at Wharton, including the MBA Core Curriculum teaching award, the Miller-Sherrerd MBA Core Teaching award and the Excellence in Teaching Award. Professor Bradlow earned his Ph.D. and master’s degrees in mathematical statistics from Harvard University and his BS in economics from the University of Pennsylvania.

The SEO metrics that really matter for your business

The SEO metrics that really matter for your business

Whether you are a business owner, marketing manager or simply just interested in the world of ecommerce, you may be familiar with how a business can approach SEO.

To every person involved, the perception of SEO and its success can vary from a sophisticated technical grasp to a knowledge of the essentials.

At all levels, measurement and understanding of search data are crucial and different metrics will stand out; from rankings to the finer details of goals and page speed.

As you may know, you can’t rely solely on ranks as a method to track your progress. But there are other, simple ways to measure the impact of SEO on a business.

In a recent AMA on Reddit, Google’s own Gary Illyes recently urged SEO professionals to stick to the basics and this way of thinking can be applied to the measurement of organic search performance.

In this article, we will look to understand the best metrics for your business when it comes to understanding the impact of SEO, and how they can be viewed from a technical and commercial perspective. Before we start, it’s worth mentioning that this article has used Google’s own demo analytics account for screenshots. If you need further info to get to grips, check out this article, or access the demo version of Google Analytics.

Each of these are commercial SEO metrics — data that means something to everyone in a business.

Organic traffic

This is undoubtedly a simple, if not the most simple way of understanding the return of any SEO efforts. The day-to-day traffic from search engines is the key measure for many marketers and any increase can often be tied to an improved level of search visibility (excluding seasonal variation).

In a world where data drives decisions, these figures are pretty important and represent a key part of any internet user’s session, whether that is to get an answer, make a purchase or something else.

In Google Analytics, simply head follow this path: Acquisition -> All Traffic -> Channels to see the organic traffic received within your chosen time period

Identifying traffic sources in Google Analytics

You might be asking, “how can I know more?”

Google might have restricted access to keyword data back in 2011, but you can still dig down into your traffic from organic search to look at landing pages and locations.

Organic traffic data – Filtered by landing page 

Not all traffic from search hits your homepage, some users head to your blog or to specific landing pages, depending on their needs. For some searches, however, like those for your company name, your homepage will be the most likely option.

To understand the split of traffic across your site, use the “Landing Page” primary dimension and explore the new data, split by specific page URL.

Understanding the traffic split using Google Analytics

Organic traffic data – Filtered by location

Within the same section, the organic search data can be split by location, such as city, to give even further detail on the makeup of your search traffic. Depending on how your business operates, the locations shown may be within the same country or across international locations. If you have spent time optimizing for audiences in specific areas, this view will be key to monitor overall performance.

Screenshot of search data filtered by city

Screenshot of the city wise breakdown of the search traffic in Google Analytics

Revenue, conversions, and goals

In most cases, your website is likely to be set up to draw conversions, whether that is product sales, document downloads, or leads.

Part of understanding the success of SEO, is the contribution to the goal of a business, whether that is monetary or lead-based.

For revenue based data, head to the conversions section within Google analytics, then select the product performance. Within that section, filter the secondary dimension by source/medium to show just sales that originate from search engine traffic.

Screenshot of the product performance list to track search originated sales

If your aim isn’t totally revenue based, perhaps a signup form or some downloadable content, then custom analytics goals are your way of fully understanding the actions of visitors that originate from search engines.

Within the conversions section, the source of your goal completions can be split by source, allowing you to focus on solely visits from organic search.

Graph on source wise split of goal conversions

If a visitor finds your site from a search and then buys something or registers their details, it really suggests you are visible to the right audience.

However, if you are getting consistent organic search visits with no further actions taken, that suggests the key terms you rank for, aren’t totally relevant to your website.

SEO efforts should focus on reaching the relevant audiences, you might rank #1 for a search query like “cat food” but if you only sell dog products, your optimization hasn’t quite worked.

Search and local visibility

In the case that your business has web and/or physical store presences, you can use the tools within Google My Business to look further into and beyond the performance of the traditional blue links.
Specifically, you can understand the following:

  • How customers search for your business
  • How someone sees your business
  • What specific actions they take

The better your optimization, the more of these actions you will see, check these out!

Doughnut graph of search volume seen in Google Analytics

Graph of customer actions

Graph of listing sources for Google my business

Average search rankings

Rankings for your key terms on search engines have traditionally been an easy way to quickly get a view of overall performance. However, a “quick Google” can be hard to draw conclusions from. Personalized search from your history and location essentially skews average rank to a point where its use has been diminished.

A variety of tools can be used to get a handle on average rankings for specific terms. The free way to do this is through Google Search Console with freemium tools like SEMRush and Ahrefs, which also offer an ability to understand average rank distribution.

With search rankings becoming harder to accurately track, the measure of averages is the best way to understand how search ranking relates to and impacts the wider business.

Graph on average positioning of the website in search

Technical metrics – Important but not everyone pays attention to these

When it comes to the more technical side of measuring SEO, you have to peel back the layers and look beyond clicks and traffic. They help complete the wider picture of SEO performance, plus they can help uncover additional opportunities for progress.

Search index – Through search consoles and other tools

Ensuring that an accurate index of your website exists is one thing that you need to do with SEO. Because if only a part of your site or the wrong pages are indexed, then your overall performance will suffer.

Although a small part of overall SEO work, its arguably one of the most crucial.

One quick way is to enter the command “site:” followed by the URL of your site’s homepage, to see the total number of pages that exist in a search engine’s index.

To inspect the status of a specific page on Google, the Google Search Console is your best option. The newest version of the search console provides a quick way to bring up results.

Screenshot of the latest Google Search Console

Search crawl errors

As well as looking at what has been indexed, any website owner needs to keep an eye out for what may be missing, or if there have been any crawl errors reported by Google. These often occur because a page has been blocked, or the format isn’t crawlable by Google.

Head to the “Coverage” tab within Google Search Console to understand the nature of any errors and what page the error relates to. If there’s a big zero, then you and your business naturally have nothing to worry about.

Screenshot of viewing error reports in Google Search Console

Click-through rate (CTR) and bounce rate

In addition to where and how your website ranks for searches, a metric to consider is how often your site listing is clicked in the SERPs. Essentially, this shows the percentage of impressions that result in a site visit.

This percentage indicates how relevant your listing is to the original query and how well your result ranks compared to your competitors.

If people like what they see and can easily find your website, then you’ll likely get a new site visit.

The Google Search Console is the best go-to resource again for the most accurate data. Just select the performance tab and toggle the CTR tab to browse data by query, landing page, country of origin, and device.

Screenshot of a CTR performance graph on the basis of query, landing page, country of origin, and device

If someone does venture onto your site, you will want to ensure the page they see, is relevant to their search, after all, search algorithms love to reward relevance! If the page doesn’t contain the information required or isn’t user-friendly, then it is likely the user will leave to find a better resource, without taking any action, known as a bounce.

In some cases, one visit may be all that is needed, therefore a bounce isn’t an issue. Make sure to view this metric in the wider context of what your business offers.

Mobile friendliness

Widely reported in 2015, was the unveiling of mobile-friendliness as a ranking factor. This is crucial to the evolution of browser behavior, with mobile traffic, often greater in volume than desktop for some sites.

Another report in the ever useful Google Search Console gives a clear low-down of how mobile-friendly a site is, showing warnings for any issues. It’s worth saying, this measure isn’t an indication of how likely a conversion is, but more the quality of your site on a mobile device.

Graph for tracking the mobile-friendliness of a website

Follow your metrics and listen to the data

As mentioned at the start of this article, data drives decisions. In all areas of business, certain numbers will stand out. With SEO, a full understanding comes from multiple data points, with positives and negatives to be taken at every point of the journey.

Ultimately, it often comes down to traffic, ranks, and conversions, the numbers that definitely drive business are made up of the metrics that don’t often see the light of day but are just as important.

As a digital marketer, it is always a learning experience to know how data drives the evolution of a business and ultimately, how successes and opportunities are reported and understood.

Matthew Ramsay is Digital Marketing Manager at Digitaloft. 

Further reading:

Related reading

Three ideas to create a high-converting product page

SEO writing guide From keyword to content brief

Brandcast 2019: YouTube updates Google Preferred algorithm, makes originals free with ads

NEW YORK — In an event laden with advertisers and influential video creators alike, YouTube’s Brandcast in New York on Thursday was a brandish of metrics, niche content development and new inventory opportunities in a glamorous pitch for ad dollars.

Key announcements included updates to the Google Preferred algorithm, a fresh YouTube TV lineup grounded in specialized interests, deeper performance insights for Google Preferred advertisers, and YouTube Originals series becoming available for free to users as an ad-supported experience.

Digging into niche markets. YouTube CEO Susan Wojcicki took to the stage to recognize the wide-reaching influence of YouTube creators – while simultaneously acknowledging the cultural and commercial impact YouTube has on advertisers.

“YouTube Creators are the cutting edge of culture, creating entirely new genres we could have never imagined beforehand and diversifying our perspectives in the process,” Wojcicki said. “Most people say the content they watched on YouTube is related to something that they are passionate about. And according to our joint research with Omnicom, relating to a passion is three times more important than whether or not there’s a big Hollywood name attached.”

In an effort to broaden YouTube TV’s channels, the company announced it’s making 70 broadcast and cable channels available as its own lineup under the Google Preferred reservation program. The initiative is designed to give advertisers access to more live and in-demand ad inventory with more focused targeting based on subscriber interests.

Google Preferred updates. YouTube announced key updates to its proprietary P-score algorithm, aimed at increasing visibility for videos with higher production value and content frequently watched on TV screens.

YouTube said it found a “significant lift” in ad recall (112 percent) and purchase intent (53 percent) from Google Preferred ads viewed on TV screens.

To provide advertisers with more resources for measuring offline sales, YouTube said it plans to make Nielsen Catalina Solutions (NCS) available for Google Preferred ads in the coming months. The tool aims to give marketers and advertisers metrics into offline sales and provide deeper insights across audiences and content creative for CPG brands in the U.S.

YouTube Originals free with ads. YouTube said it’s making its original programming free for all users under an ad-supported streaming model. In addition to returning shows – featuring celebrities and influencers like Liza Koshy and Kevin Hart – YouTube plans to add a slate of new shows to the mix. While it’s a worthy effort to address viewer demands, the expansion underscores YouTube’s effort to cater to the diverse targeting opportunities for advertisers.

Why we should care. YouTube has the highest share in reach and watch time across all ad-supported OTT platforms, according to Comscore OTT Intelligence and Custom Reporting. The rising streaming trend is already disrupting addressable TV ad products, and platforms like YouTube are competing head-to-head with networks for ad dollars.

YouTube’s focus on content quality and ad-supported programming is tipping the scales for digital advertisers, who are now faced with more specialized targeting options than ever before.


About The Author

Taylor Peterson is Third Door Media’s Deputy Editor, managing industry-leading coverage that informs and inspires marketers. Based in New York, Taylor brings marketing expertise grounded in creative production and agency advertising for global brands. Taylor’s editorial focus blends digital marketing and creative strategy with topics like campaign management, emerging formats, and display advertising.

Progressive web apps (PWAs) for SEO: Benefits, stats, examples

How progressive web apps positively impact your SEO

The last couple of years have made a few things very clear. If you have a business online, you need to make it your business to be mobile-first.

Second, your mobile experience needs to be smooth and frictionless if you want it to translate into dollars. Lastly, smartphone users are super fickle and despite downloading over 113 billion apps in 2018, users still regularly use only about 9 apps per day.

So, you need to be on mobile. You need to be awesome on mobile. And people are probably not going to download and use your app regularly. What do you do then?

Build something that combines the slick, user-friendly interface of a mobile app without actually creating an app.

Yes, I’m talking about progressive web apps or PWAs.

In the simplest possible words, a PWA is a mobile-friendly website that behaves like an app but doesn’t need to be downloaded to be used. Users have the option to save a PWA to their phone and launch it just like an app, but it’s totally optional.

Screenshot example of how Starbucks used a progressive web app

There are a whole host of perks that PWAs bring with them while overcoming the inherent disadvantages of building and maintaining a mobile site and a mobile app simultaneously. Let’s take a deeper dive to see how you can get the most out of PWAs.

Speed, thy name is PWA

This is undoubtedly one of the most exciting features of PWAs. Businesses can target users who might be on a slow data connection or even those who are offline with a PWA by using mobile development best practices like caching content ahead of time, compression, and more.

Why should you care about site speed? Because it directly impacts your SEO and your conversion rate.

In January 2018, Google formally announced what many SEO experts suspected for a while that mobile speed would be a key factor in organic search rankings for websites. With that came the mad rush to mobile optimize websites, improve page load times, improve navigation, and the works. In the case of PWAs, pages load instantly due to pre-caching and allow users a quick and simple user experience. A definite SEO win.

Research has shown over time that there is a correlation between site speed and conversion rates. A drop in site speed usually leads to a corresponding drop in conversion rates and vice versa.

Think with Google's stats on site speed and conversions

Source: Think with Google

Comparitive chart of PWAs vs native apps vs responsive websites

Source: One North

Websites can enjoy vastly improved conversion rates with the faster page load times that PWAs offer. Cosmetics giant Lancome switched to a PWA in 2017 and saw a significant improvement in both speed and conversion rates. They experienced an 84% drop in time until the page is interactive and a 17% growth in conversion rates.

Better engagement

Google dictates the fundamental requirements that a website needs to fulfill to qualify as a progressive web app. A smooth user experience including easy navigation, timely push notifications, cross-browser compatibility, responsive pages across all devices are a few important requirements that also lead to a growth in engagement.

PWAs mimic real mobile apps by allowing users to install them on their devices. With the app now on their mobile phones, the chances of interaction and engagement become exponentially higher, as experienced by Forbes magazine when they launched their own PWA. Users were notified every time new content was available via push notifications. With lightning-fast page load times, quick transitions and light page design, Forbes’ PWA managed to achieve the following:

  • Increase scroll depth by 3x
  • Improve sessions per user by 43%
  • Get a 6x increase in readers completing articles
  • Double their engagement rate which means a 100% increase in engagement

In the case of a publishing site like Forbes, high engagement equals high conversions, all thanks to their new PWA.

We know that website engagement metrics like session duration, click-through rates, and bounce rates have a direct impact on search rankings. As Larry Kim demonstrates here, time on site has a definite correlation with your organic search rankings. The higher the session duration, the higher your likely ranking on Google.

Source: Medium

You can say hello to page one on Google, all thanks to PWAs and their superior website engagement rates.

It’s all about the URLs

Progressive web apps truly embrace SEO best practices in every sense of the term. From clear and concise meta descriptions to adding Schema.org data for better indexing and parsing of site data by search bots; a search-optimized website is more likely to make the PWA cut than others.

PWAs don’t require different “mobile.site.com” types of URLs to offer a great experience on mobile devices. They’re automatically configured to provide a consistent experience, no matter what the device. Another bonus is that PWAs are necessarily HTTPS enabled. Not only does this bump up your site on organic search results but also reassures users about the security on your site leading to lower bounce rates, higher click rates, and likely higher conversion rates.

Each page comes with its own unique URL, making even deeply embedded pages easily crawlable and discoverable by search engines. Unique URLs for each page also makes sharing pages on social media and other sites much easier, not to mention more transparently trackable.

With pre-caching in place using service workers, all URLs on PWAs load even when your device is offline, empowering users who operate on older devices or poor network connections.

In closing

As users evolve and express their preferences more clearly, it is up to businesses to ensure that they pick up on these signals and adapt to stay relevant to their target audience. Today’s user is telling us that they expect a fast and frictionless journey on their mobile devices, without being forced to download an app for this superior user experience.

Time to pick up on those cues and invest in PWAs that combine ease of the mobile web with the speed and user-friendliness of a mobile app. Two for the price of one is what you get with PWAs. So when are you going to build yours?

Rohan Ayyar is Regional Marketing Manager at SEMrush. He can be found on Twitter .

Related reading

Three ideas to create a high-converting product page

SEO writing guide From keyword to content brief

Using Python to recover SEO site traffic (Part three)

Here’s how brand marketers can use immersive technology to build an effective retail experience

It’s your typical overcast Saturday in downtown Portland, Oregon, and I’m heading out to the park to walk my dog, Betty. What I find this particular evening is anything but typical as instead of a few homeless guys sleeping on benches and fellow dog walkers, I encounter hundreds of people of all ages walking through the south park blocks. Their excitement was infectious, and I was delighted to see so many Portlander’s enjoying one of the cities most prized resources. But what made this Saturday different from every other and why had this happy mob descended on my neighborhood?

As I took a closer look, I noticed that everyone was engaging with their phones, some even had two, three, up to four different phones. I had to learn more about what was going on and if my suspicions were true that this was some sort of online community. My thoughts immediately went to Pokémon Go, but wasn’t that a thing of the past and had that game appealed to such a cross-section of the population? There were families, young children, groups of teens, adults – some solo but the majority were traveling in packs. I stopped one group who were kind enough to answer my newbie questions and learned this was indeed a Pokémon Go Community Day. A special global event that features rare Pokémon and other in-game goodies during a dedicated window of time. According to Wikipedia, Pokémon Go has accrued over a billion downloads worldwide and has 147 million monthly active users.

So how does this story relate to immersive retail and fashion? Good question! Love or hate Pokémon Go, there’s no denying that it is the most broadly used immersive app to date. The secret sauce its creator, Niantic, has cooked up is chock full of lessons for all of us looking to leverage immersive technologies to build brand experiences and ultimately sell more stuff. Let’s dive a bit deeper into how brand marketers can build effective fashion and retail experiences using immersive technology.

1. It needs to be social

The most successful digital disruptors over the last few years have one thing in common, they build social into their DNA. Recent examples include Pokémon Go and Peloton,  who has grown a $4 billion dollar business by replicating the community of an actual fitness class at home.  A great example of this within the fashion industry is China’s Tmall. This shopping app has leveraged immersive technology to provide their online audiences access to VIP events such as the hugely popular “See Now, Buy Now” event last year.

This “retail-as-entertainment” event is part of Alibaba’s Singles Day shopping event and featured big-name designers, celebrities, musical productions and much more all filmed live in front of a select VIP audience. The live-stream was broadcast across both immersive and 2D channels to over 57 million viewers and included a streamlined ‘see now, buy now’ app that allowed viewers to buy the products they saw on the runway instantly. The show also offered a “Play Now” feature that allowed the viewers to rank the outfits in real-time, creating an instant trend report and sending feedback to the designers. According to Sean Lane, immersive retail specialist and Technology Principal at digital studio Point B, the Singles Day event “had over 8 million users make purchases using their VR headsets. They have also been very successful with Tmall VR experiences with users watching fashion shows on the runway and leveraging the ‘purchase now’ feature.”

2. Provide value to the customer

What differentiates a good immersive experience from another is the value it offers to the user. To pay off the hassle of either strapping on a VR headset or downloading an AR app, the user must gain substantial value from the result. There are several ways that innovative brands are both meeting their business objectives while meeting the needs of customers. Immersive technology is an amazing way to take users to places they otherwise wouldn’t be able to go. Providing customers something they want and can’t get anywhere else is a good formula for success. One B2B fashion app based in Paris, Change of Paradigm, offers designers and brands the ability to do just that. Their high-quality, 3D models of luxury brand apparel are the best I’ve seen. If I were a clothing designer, I would want its Paris studio director, Franck Audrain, to create the digital version. A fashion designer in his own right, Audrain has spent years in the technology industry and meticulously mimics the most complicated garments in 3D. His team can create a hyper-realistic version of an already exiting garment or build a digital proto-type of a garment that only exists in the imagination of its designer.

This recent AR experience at Paris department store, Bon Marché, shows the detail captured in Change of Paradigm’s 3D fashion technology.

The company has a proprietary technology that digitally duplicates each fabric to realistically depict how the garment will flow when moving through space. This attention to detail and the fact that they can output the 3D assets across multiple channels such as web, VR and mobile AR make their offering compelling to luxury brands.

They are working on a virtual try-on experience that will rival anything we’ve seen to date but this is still several years away. According to founder Henri Mura, “currently effective immersive experiences for trying on apparel is limited to jewelry, accessories and footwear. For clothing, if you want to go beyond a simple 2D overlay, you really need to understand how the material will fit a customer’s unique shape in 3D and then represent that in the immersive environment. We’re working on a solution, but it has to be perfect to provide true value.”

Other ways brands can provide value to shoppers can include something as simple as easing friction along the path to purchase, such as the ‘See Now, Buy Now’ feature in the Tmall VR shopping app or creating a memorable experience. Macy’s successfully used virtual reality to allow Chinese shoppers the rare opportunity to visit their flagship store in New York without having to leave China. Ensuring that the immersive journey is as intuitive and seamless as possible is an important part of the recipe for success. Many U.S. brands are still struggling on that front as immersive experiences often require unique downloads and a series of user actions before accessing the experience. Puma’s recent launch of an AR shoe is an example where the user needs to download a stand-alone app that can recognize the shoe to use special decorative filters similar to SnapChat’s lens feature. I’m not so sure I would find that valuable.

3. Leverage the right immersive technology for the job

Before building any immersive experience, it’s essential to understand your objectives, your audience and the technologies at your disposal for bringing your vision to life. There are still quite a few challenges to consider when building an immersive experience and striking the right balance between quality and scale is essential. Are you trying to reach a high-stakes, niche audience like the 1% who can afford luxury items or anyone who has access to a smartphone? Is your marketing objective strictly to sell more product or are you looking to build a connection with your audience? These types of questions need to be clearly defined before getting started so that you can determine the best flavor of immersive – Augmented Reality, Virtual Reality or Mixed Reality – for the job.

There have been several AR, retail experiences that have been dumbed-down for mobile to scale with not so great results leading to posts like this one dismissing the value of immersive retail technology.

Immersive retail specialist, Sean Lane, breaks it down this way: “I think latency, ease of use and accessibility are still impeding factors to adoption. I have seen Virtual Reality gain limited adoption inside brands, mostly for HR onboarding, marketing and training. I have built a few pilots testing VR internally for training, planning, global development and the like. While the experiences are good, they are not good enough. Many people still get motion sickness and the graphics are not realistic enough. Interoperability with other platforms is not seamless. However, I still believe there are times when VR is the right tool for the job. When you want to have complete control over an experience and direct the process, then VR enables a brand to do that. I think that Augmented Reality and Mixed Reality have a greater chance of widespread adoption in enterprise and retail.”

Where to start?

There are several resources available for fashion brands looking to leverage immersive technology. Hiring a specialist or creative agency to build a strategy isn’t always an option but a great first step if the budget is available. Other less costly resources include publications like Medium, which hosts a community of immersive professionals sharing insights, and marketing sites like MarketingLand.com. One specific community of brands looking to solve some of the issues surrounding 3D technologies for apparel and footwear is the 3DRC (3D Retail Coalition), which is made up of brands, technologists and educators.

The best and most important advice I can you leave you with comes from Lane, who wisely proclaims: “The biggest win for any of these technologies is to ensure the use is authentic to your brand and not forced. When immersive is used to create real experiences that enhance consumer interaction with your brand or to build brand loyalty or connection, THIS will lead to better results.”


Opinions expressed in this article are those of the guest author and not necessarily Marketing Land. Staff authors are listed here.


About The Author

Lisa Peyton is an immersive media strategist and media psychologist focusing on the user engagement and marketing applications of new technologies.