Is your landing page engaging your target customers? How can you increase ROI without increasing marketing budget? Both of these questions can be answered by a well set on-site analytics routine.
You cannot improve what you are not measuring. This makes web analytics the most important growth tactic out there.
But are we measuring enough?
Most digital marketers out there believe they are already incorporating web analytics by using Google Analytics and monitoring daily traffic sources.
While Google Analytics is a great platform, there’s much more into web analytics than using one platform (especially if you are not technical enough to make use of event tracking).
As technology is evolving, you need to always be looking for more and more ways to analyze your page performance to discover new growth opportunities and understand your target customers better.
Here are a few on-site analytics ideas for you to experiment with:
Conversion optimization analytics
These questions will lead you to stats that provide actionable insights about your page and user behavior.
Are your on-page CTAs engaging your page users?
The purpose of conversion tracking is to analyze which of your on-page calls-to-action engage your customers best.
There are several events and conversion tracking solutions out there, including the most obvious one, Google Analytics.
Further reading:
But you know that I love newer less-discussed tools that can bring an innovative perspective or method to the table.
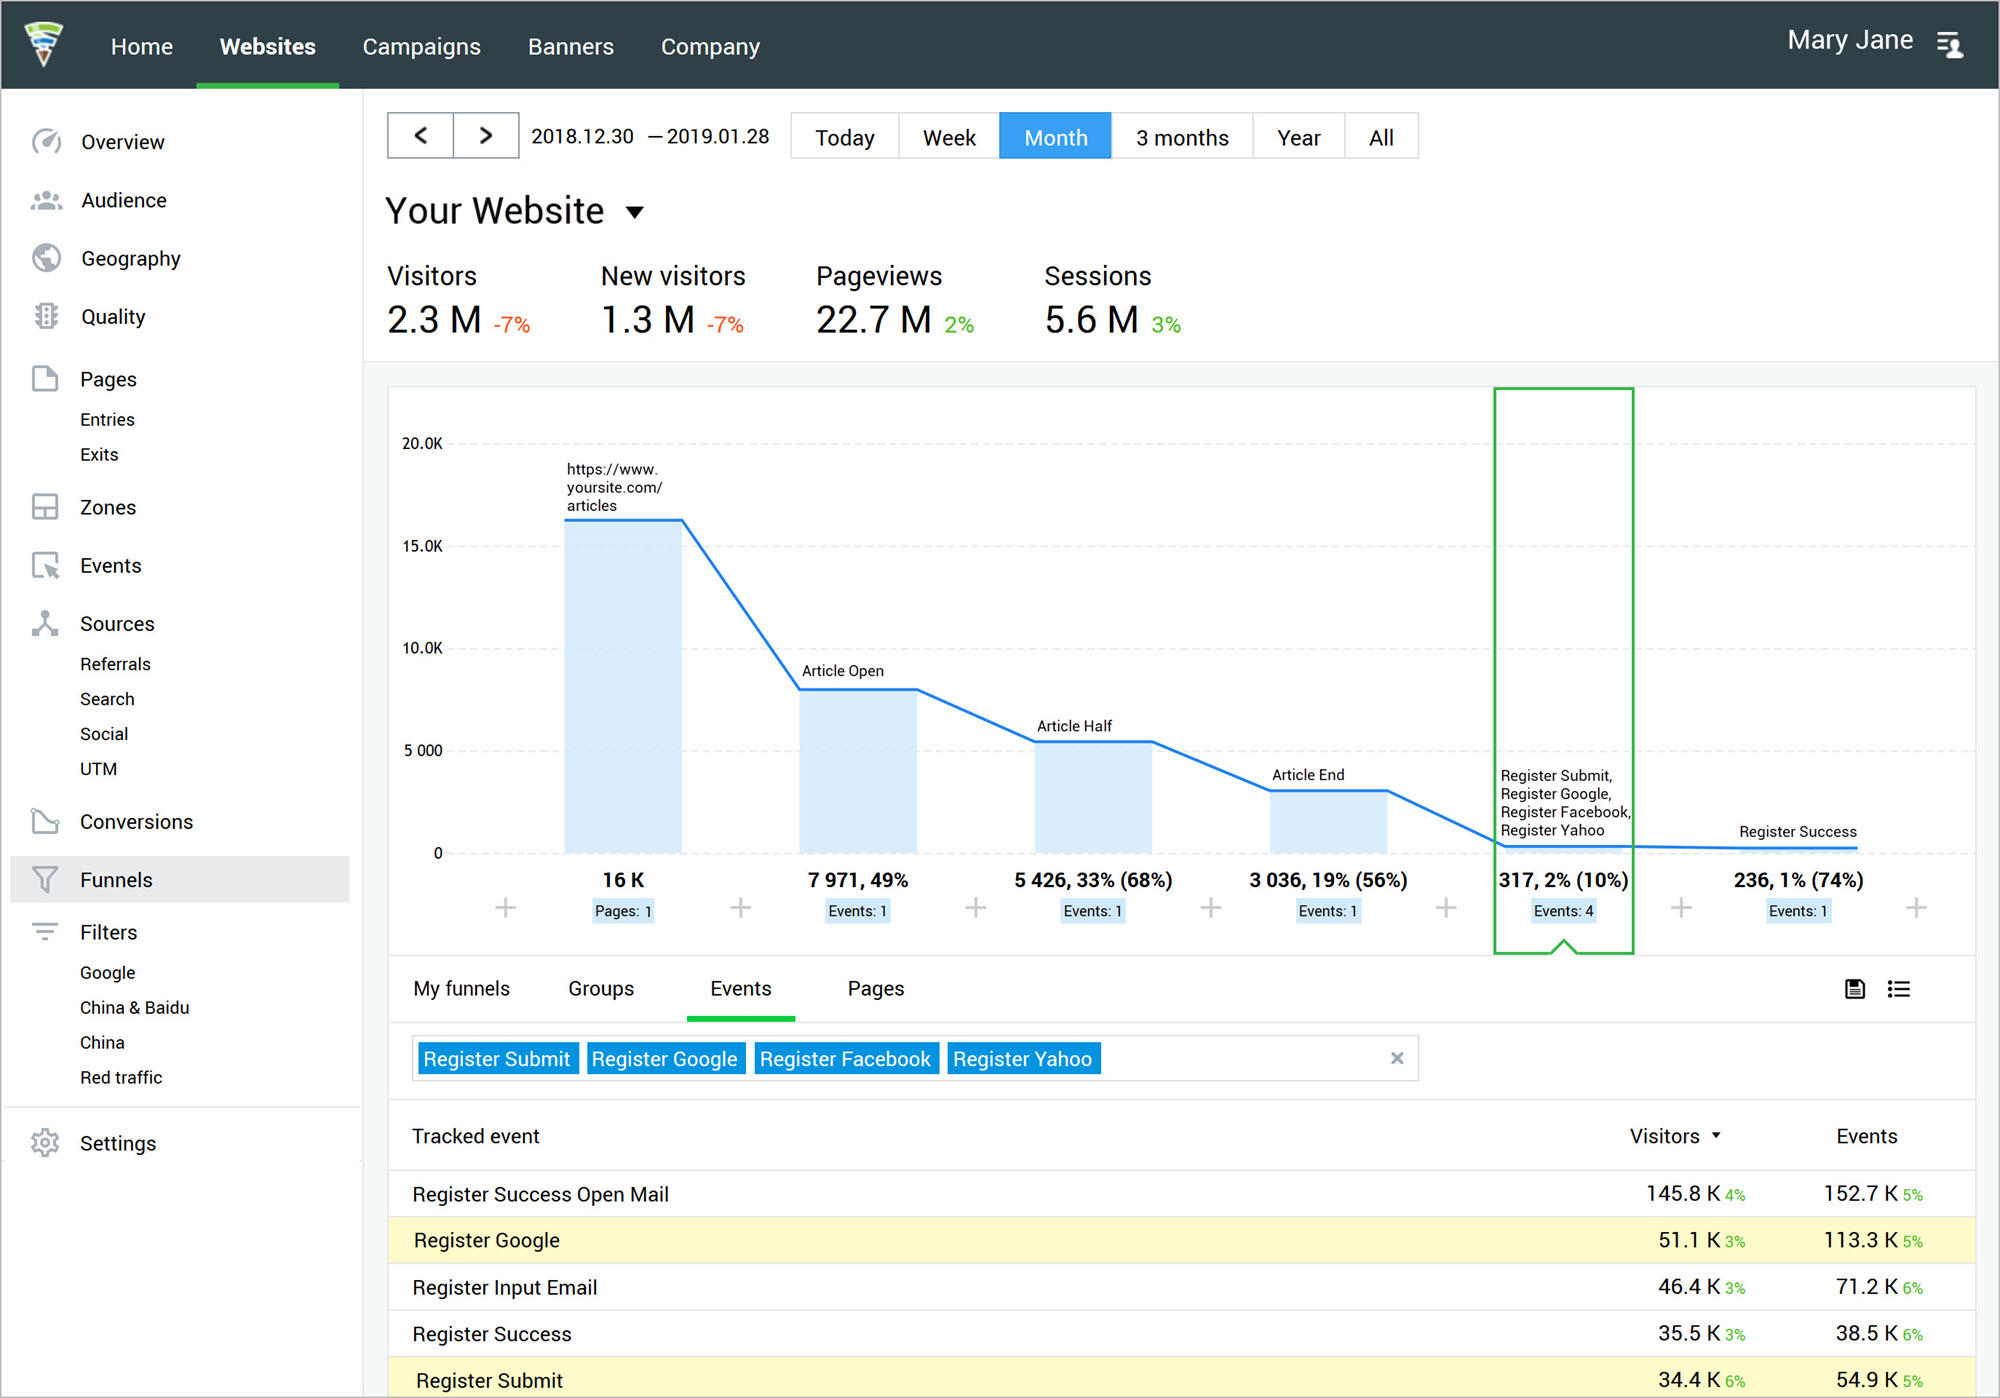
Finteza is a free web analytics platform that focuses on monitoring and analyzing conversions. The unique feature of Finteza is its unique conversion analysis that shows how your customers are engaging with each step inside your conversion funnel.
You can track multiple calls-to-action and compare how they perform at what stage of your conversion funnel.
To use Finteza:
- Install its tracking code (this part is similar to Google Analytics).
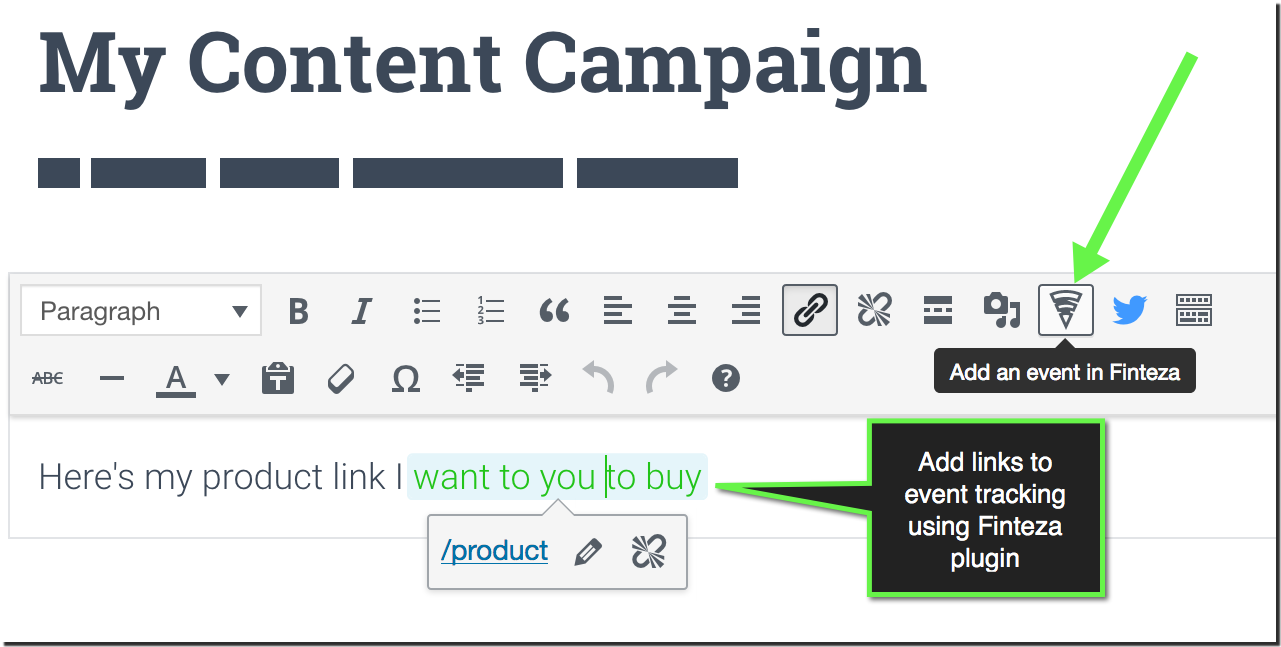
- Add your events (which is much easier than Google Analytics). You can even use their plugin that lets you add links to events using WordPress visual editor.

Once all your events are set-up, you can build your funnels inside the “Funnels” section by simply selecting your events to see within one report:

Which page elements draw your users’ attention?
Another great way to analyze your page performance is to use heatmaps.
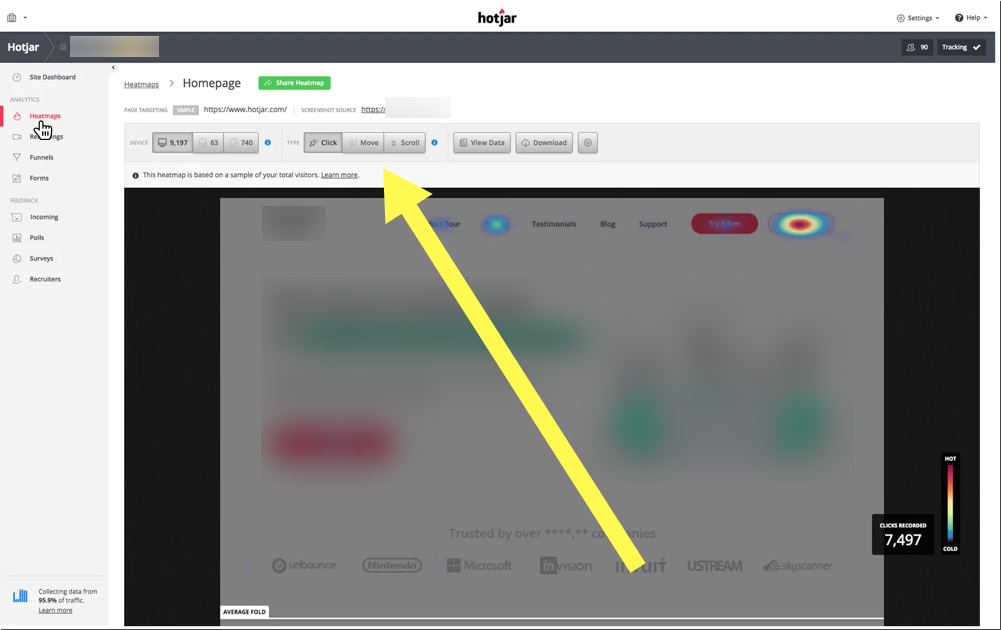
A heatmap is a visual color-coded representation of user behavior on your site. Here’s more in-depth information on heatmaps. There are several types of heatmaps that can help you get a more in-depth understanding of what people tend to do once they land on your page:
1. Click maps visualize which links and buttons attract most clicks. These are great to analyze whether your CTA or a banner attracts most on-page interactions (clicks).
2. Move maps visualize where desktop users move and pause their mouse. These could be used to identify parts of the page that distract your users from your main CTAs.
3. Scroll maps visualize how many people scroll down to any point on the page. This is perfect if you want to see how deep into your long-form content your readers tend to get.
You can easily set up any or all of these heatmaps to track your page using Hot Jar. To use HotJar, simply install their tracking code. From there you can set up any type of tracking for any page of yours inside HotJar dashboard.

HotJar is free unless you want to track more than 2,000 page views a day (my tests usually include 1,000 views only).
By analyzing and aggregating user behavior, heatmaps give an overview of how web page users interact with the page. This helps understand on-page engagement trends and optimize for higher conversions.
While conversion tracking tools are all about understanding what engages your users, using heatmaps will help you clearly see what distracts your page users from converting as well as what can help you draw their eyes to more important elements of your page.
For example, if they keep clicking your image instead of your CTA, or if they keep ignoring your important links (or scroll right through them), you know that you need to re-position your site elements and remove a distracting image.
On-page SEO analytics
Is your content targeting the intended audience?
Search intent is by far the most important metric out there determining how well the page meets your target customer’s needs:
- Why do people type certain words in the search box? What do they intend to do?
- Does your page give them what you need? Does it provide a solution?
In other words, search intent reflects the user’s intended action behind each search query. It defines whether your page has any chance to convert at all. With voice search on the rise, meeting the users’ immediate needs should be any business’s priority, which is why search intent has become a much hotter topic these days.
Both of these questions can be answered by intent analysis. Text Optimizer is the fastest way to analyze whether your page is likely to satisfy the needs of your page intended audience.

Text Optimizer applies semantic analysis to create a visual representation of the intended audience and whether the page is likely to meet their expectations. To install, simply copy-paste the URL of your page and the tool will do the job.
Is your web page optimized enough?
Finally, the most boring, yet still necessary page analysis tactic is to check if your page is sufficiently optimized. In many cases, when you seem to be struggling to get your page one to two positions up, on-page SEO analysis is the answer.
Serpstat’s Text Analysis feature provides a fresh perspective on how on-page analytics should be done. It determines the keywords all your more successful organic search competitors have and shows where exactly you want to include those on your page:
To use the Text Analysis feature:
- Run your keyword list (for Serpstat to group it into thematic clusters)
- Click through to “Text Analytics” tab and provide your landing page URL that you want to rank for each group
- Wait for the tool to analyze the content of your top-ranking competitors and provide the list of keywords that seem to “move the needle”, keywords that appear in most high-ranking pages for a certain query group.
Serpstat’s text analysis goes through your top ten organic competitors, compares its content and generates a list of keywords that appear on all of them. The idea behind this is actually brilliant: We don’t know why a certain page is ranking higher than your page, so whatever is able to move the needle is worth trying.
Takeaways: New analytics tools and tactics to experiment with
- Try setting up user behavior tracking and event analytics with Finteza
- Set up HotJar to monitor on-page engagement with heatmaps
- Analyze whether your page satisfies search intent using Text Optimizer
- Analyze what should be included in your on-page copy using Serpstat
In order to develop a sound digital marketing strategy, you need to know and understand your target market and how users engage with your site.
This research should be repeated at least quarterly, since markets can easily change, even in a short period of time. You may also find that you are able to expand your target market, leading to greater revenue generation, and wider reach.
On-site analytics is a continuous process. It never really ends. You need to continue analyzing and comparing your page performance and user engagement metrics to keep up with new user expectations, new traffic sources and new tactics your competitors are implementing to attract and engage customers to their sites.
Ann Smarty is the blogger and community manager at Internet Marketing Ninjas. She can be found on twitter @seosmarty.
Related reading
If you care about where and how you appear on search engines, Google Search Console and its updates will be of much interest to you.
In Nov 2017, Venngage enjoyed 275,000 visitors a month from organic search traffic. Today (16 months later) it’s 900,000. Details of how they did it.
DuckDuckGo could be your new default search engine if you want to focus on privacy and security. What it’s like using it nowadays?


