Here’s how to get the most out of your marketing analytics investment

Gartner recently published their Predicts 2019 research report, outlining several converging trends that pose a threat to CMOs and marketing organizations. The report also makes several bold predictions including that “by 2023, 60 percent of CMOs will slash the size of their marketing analytics departments by 50 percent because of a failure to realize promised improvements.”

The number one success factor for CMOs today is the ability to effectively leverage customer data and analytics. And yet, according to Gartner’s report, companies today are clearly not demonstrating consistent return on that investment, a problem which often stems from a lack of marketing analytics leaders and the organizational structure necessary to effectively translate data and insights into action.

To discuss in more detail, we chatted with one of the authors of the Gartner report, Charles Golvin, to explore what CMOs and marketing leaders can do to buck the prediction and drive stronger results for their marketing analytics investment.

Our conversation, coupled with my own experience, solidified five ways CMOs can improve return on their marketing analytics investment, while also reinforcing why it matters:

1. Build organizational structure to apply better data

Knowing how to effectively leverage customer data and analytics is the number one success factor for CMOs today. And yet, to fully leverage the power of analytics, companies need to develop organizational structure and processes to be able to identify, combine and manage multiple sources of data.

As Golvin puts it, “companies need to build a better pipeline of carrying data from its raw state to decision and action systems for data science leaders to apply insights and powerful analysis to determine the right action and right strategy.”

To build these pathways, companies need a strong methodology coupled with an approach for how data gets aggregated, digested and applied to their various marketing systems.

2. Develop analytics leaders who bridge both data science with marketing strategy

Another key success factor for companies is developing and hiring the right leaders who can bridge both data science and business strategy. Simply put, analytics leaders need to know enough about business to ask the right questions of data. Only then, can they apply data and models to yield better decisions and drive sustainable growth.

This is our philosophy at Wharton – preparing well rounded, analytically-adept business leaders who don’t ask what data can do for them, but what data is needed to increase customer lifetime value (CLV) and how to apply data and customer insights to shape brand strategy.

Gartner regularly conducts surveys about different challenges that CMOs and marketers face, and every year, the one that rises to the top is finding skilled data and analytics leaders to hire,” shares Golvin. “Companies also struggle to find those ‘unicorns,’ or people able to command both data science and business strategy.”

Golvin also pointed out that once a company does hire an analytics leader, companies need the right foundation in place to foster their success. “There’s no value to hiring a data scientist whose output leadership doesn’t understand or know how to implement.”

Too often, we see traditional marketing organizations that aren’t able to effectively apply analytics or don’t understand how to frame the questions for data scientists on their team. The reverse is also a common challenge: analytics leaders don’t grasp how to use data to shape the broader business and brand strategy.

3. Hire a Chief Analytics Officer, or up-level the importance of analytics

So how do companies up-level the importance of analytics and develop the data-driven culture, capabilities and leaders needed to successfully transform their organization? One trend we are seeing is the emergence of the Chief Analytics Officer or Chief Data Scientist across more organizations.

As Golvin notes, “we’re already starting to see the emergence of Chief Marketing Technology Officers, who are focused on deployment of the right technology, architecture and capabilities. The next trend may be marketing analytics leaders at the c-level, who are purely about analytics and understanding the data.”

When companies empower analytics leaders to lead strategy, it can transform the culture, providing a clear vision for what customer data will be used and how to reach the desired business impact. When companies fail to make this investment, it leaves high-caliber professionals in a quandary.

“Too often data science leaders end up doing grunt work such as basic data processing and preparation, rather than using their analytics mindset and abilities to drive actionable marketing strategy, separate the signal from the noise and improve marketing outcomes,” notes Golvin.

4. Focus on better data, not big data

An ongoing challenge organizations face today is what we call “better data, not big data.” Too often we see companies that are collecting data for data’s sake, rather than taking a lean approach where they only collect data when it helps to optimize the experience for their target customers or better prediction of future behaviors.

“As data becomes more integral to marketers, a ‘more is better’ attitude develops, without necessary consideration given to the downside risks,” notes Golvin. “Companies need to do a better job of being transparent about what data they use and how, as well as considering the pros/cons, and risks of incorporating that data into a profile of their customers. More data does not necessarily lead to greater business intelligence – and in many cases can expose the brand to issues that impact customer trust.”

Data collection is in no one’s interest when it’s not meaningfully tied to strategy.

5. Separate the signal from the noise to predict and optimize business outcomes

Improving ROI for marketing analytics requires constant learning and experimentation to separate the signal from noise. There’s no better way to learn about your customer than to see what works and what doesn’t.

While big data and machine learning are great to business intelligence, a well-controlled experiment can deliver far more value. Finding the most impactful experiments to run starts with asking the right questions and maintaining a test and learn mindset where you’re constantly evolving to improve the experience for customers. The iterative adaptation based on these experiments builds momentum.

Many marketers know the “Holy Grail” phrase “deliver the right product to the right person at the right time.” In the past, this was more difficult because we didn’t know where consumers were. Now when marketers use better data, they know where the customer was and is more likely to be – providing the foundation for the ultimate in contextual 1:1 marketing.


Opinions expressed in this article are those of the guest author and not necessarily Marketing Land. Staff authors are listed here.


About The Author

Jeremy Korst is the president of GBH Insights, a leading marketing strategy, consumer behavior and analytics consultancy. In his role, Jeremy works closely with Fortune 500 brands and CMOs to solve marketing challenges, improve customer experience and create strategies for growth. Prior to GBH, Jeremy held CMO or senior executive roles with Avalara, Microsoft, T-Mobile, among other brands. Korst holds a BA in economics from the University of Puget Sound and an MBA in finance and strategy from the Wharton School, University of Pennsylvania. He serves on boards of both institutions, as well as those of several technology startups. Eric T. Bradlow is the chairperson of Wharton’s Marketing Department, K.P. Chao professor, professor of marketing, statistics, economics and education, and co-director and co-founder of the Wharton Customer Analytics Initiative. He is also the co-founder of GBH Insights, a leading marketing strategy, consumer behavior and analytics consultancy. He has won numerous teaching awards at Wharton, including the MBA Core Curriculum teaching award, the Miller-Sherrerd MBA Core Teaching award and the Excellence in Teaching Award. Professor Bradlow earned his Ph.D. and master’s degrees in mathematical statistics from Harvard University and his BS in economics from the University of Pennsylvania.

Digital marketers on Pinterest IPO: Get in early while costs are low, learning opportunities are high

Pinterest’s Chief Product Officer Evan Sharp and CEO Ben Silbermann

Pinterest debuted on the New York Stock Exchange on Thursday under the ticker symbol PINS. The stock climbed 28.4% over the course of the day, with a market cap of nearly $13 billion.

Following the company’s IPO, CEO Ben Silbermann told CNBC that Pinterest is less focused on making itself a platform where users talk to friends every day or follow celebrities, and instead, thinks of itself as more of a utility.

“I think that’s something we’re enabled to do by the fact that we’re an inspiration platform. We don’t claim to be a free speech platform or a place that everyone can publish anything,” said Silbermann, “The really cool thing about advertising on Pinterest is that people are there to get inspiration and do things, and that often means buying.”

Advertisers should get in early. January Digital’s CEO Vic Drabicky believes Pinterest has an immense opportunity from a revenue perspective with advertisers hungry for new channels and new ways to diversify their ad spend.

“The platform is in the infancy of building out its advertising model. If they continue to develop the right tech stack, they will grow exponentially,” said Drabicky, “We are already seeing our clients make this shift and the IPO will only generate more opportunity for Pinterest as a brand.”

Drabicky recommends CMOs get in early while the costs are still low and the learning opportunities are high.

“It’s a great environment for testing. As an agency, we always advise clients to reserve 30 percent for a testing budget,” said Drabicky, “This is especially the case with Pinterest, as testing with Pinterest has two benefits: 1. Testing allows a brand to push the envelope, and 2. Testing gets brands in the door with Pinterest before costs rise in the big three environment (Amazon, Google, Facebook).”

4C CMO reports high-growth in Pinterest ad spend.  “We’ve seen triple-digit increases in year-over-year spend for Pinterest advertisers using the Scope by 4C platform,” said 4C CMO Aaron Goldman, “Going forward, we expect to see continued investment in ad offerings and geographical expansion.”

Goldman believes Pinterest plays an important role in the media mix by helping brands reach audiences at key moments of inspiration.

“While other channels specialize in facilitating high-level brand awareness or direct-response purchase activity, Pinterest generates results across the entire marketing funnel.”

Why we should care. Now that it’s a public company, Pinterest will be committed to driving revenue — putting even more of its efforts and resources into building out its ad platform and delivering more e-commerce options for advertisers.

Silbermann told CNBC that he is focused on expanding the company’s global presence and making it a place where businesses can reach their target audiences.

“Over the last couple years and for the foreseeable future, we’re going to work on bridging that gap between seeing something inspirational and finding a product from a retailer that you trust at a price point that makes sense for you,” said the CEO.

To underscore its e-commerce goals, Pinterest recently hired Walmart’s former CTO Jeremy King as its new head of engineering. After leading the technology teams for the likes of Walmart and eBay, King brings a wealth of e-commerce technology experience to Pinterest.


About The Author

Amy Gesenhues is Third Door Media’s General Assignment Reporter, covering the latest news and updates for Marketing Land and Search Engine Land. From 2009 to 2012, she was an award-winning syndicated columnist for a number of daily newspapers from New York to Texas. With more than ten years of marketing management experience, she has contributed to a variety of traditional and online publications, including MarketingProfs.com, SoftwareCEO.com, and Sales and Marketing Management Magazine. Read more of Amy’s articles.

How to optimize paid search ads for phone calls

paid search phone calls

There have been an abundance of hand-wringing articles published that wonder if the era of the phone call is over, not to mention speculation that millennials would give up the option to make a phone call altogether if it meant unlimited data.

But actually, the rise of direct dialing through voice assistants and click to call buttons for mobile search means that calls are now totally intertwined with online activity.

Calling versus buying online is no longer an either/or proposition. When it comes to complicated purchases like insurance, healthcare, and mortgages, the need for human help is even more pronounced. Over half of consumers prefer to talk to an agent on the phone in these high-stakes situations.

In fact, 70% of consumers have used a click to call button. And three times as many people prefer speaking with a live human over a tedious web form. And calls aren’t just great for consumers either. A recent study by Invoca found that calls actually convert at ten times the rate of clicks.

However, if you’re finding that your business line isn’t ringing quite as often as you’d like it to, here are some surefire ways to optimize your search ads to drive more high-value phone calls.  

Content produced in collaboration with Invoca.

Four ways to optimize your paid search ads for more phone calls

  1. Let your audience know you’re ready to take their call — and that a real person will answer

If you’re waiting for the phone to ring, make sure your audiences know that you’re ready to take their call. In the days of landlines, if customers wanted a service, they simply took out the yellow pages and thumbed through the business listings until they found the service they were looking for. These days, your audience is much more likely to find you online, either through search engines or social media. But that doesn’t mean they aren’t looking for a human to answer their questions.

If you’re hoping to drive more calls, make sure your ads are getting that idea across clearly and directly. For example, if your business offers free estimates, make sure that message is prominent in the ad with impossible-to-miss text reading, “For a free estimate, call now,” with easy access to your number.

And to make sure customers stay on the line, let them know their call will be answered by a human rather than a robot reciting an endless list of options.

  1. Cater to the more than half of users that will likely be on mobile

If your customer found your landing page via search, there’s a majority percent chance they’re on a mobile device.

While mobile accounted for just 27% of organic search engine visits in Q3 of 2013, its share increased to 57% as of Q4 2018.

Statistic: Mobile share of organic search engine visits in the United States from 3rd quarter 2013 to 4th quarter 2018 | Statista

That’s great news for businesses looking to boost calls, since mobile users obviously already have their phone in hand. However, forcing users to dig up a pen in order to write down your business number only to put it back into their phone adds an unnecessary extra step that could make some users think twice about calling.  

Instead, make sure mobile landing pages offer a click to call button that lists your number in big, bold text. Usually, the best place for a click to call button is in the header of the page, near your form, but it’s best practice to A/B test button location and page layouts a few different ways in order to make sure your click to call button can’t be overlooked.

  1. Use location-specific targeting

Since 2014, local search queries from mobile have skyrocketed in volume as compared to desktop.

Statistic: Local search query volume in the United States from 2014 to 2019, by platform (in billions) | Statista

In 2014, there were 66.5 billion search queries from mobile and 65.6 billion search queries from desktop.

Now in 2019, desktop has decreased slightly to 62.3 billion — while mobile has shot up to 141.9 billion — nearly a 250% increase in five years.

Mobile search is by nature local, and vice versa. If your customer is searching for businesses hoping to make a call and speak to a representative, chances are, they need some sort of local services. For example, if your car breaks down, you’ll probably search for local auto shops, click a few ads, and make a couple of calls. It would be incredibly frustrating if each of those calls ended up being to a business in another state.

Targeting your audience by region can ensure that you offer customers the most relevant information possible.

If your business only serves customers in Kansas, you definitely don’t want to waste perfectly good ad spend drumming up calls from California.

If you’re using Google Ads, make sure you set the location you want to target. That way, you can then modify your bids to make sure your call-focused ads appear in those regions.  

  1. Track calls made from ads and landing pages

Keeping up with where your calls are coming from in the physical world is important, but tracking where they’re coming from on the web is just as critical. Understanding which of your calls are coming from ads as well as which are coming from landing pages is an important part of optimizing paid search. Using a call tracking and analytics solution alongside Google Ads can help give a more complete picture of your call data.

And the more information you can track, the better. At a minimum, you should make sure your analytics solution captures data around the keyword, campaign/ad group, and the landing page that led to the call. But solutions like Invoca also allow you to capture demographic details, previous engagement history, and the call outcome to offer a total picture of not just your audience, but your ad performance.

For more information on how to use paid search to drive calls, check out Invoca’s white paper, “11 Paid Search Tactics That Drive Quality Inbound Calls.”

Related reading

facebook dynamic ads, a beginners guide

Drive customer retention with Google Dynamic Remarketing

six tips for b2b paid search success

Why mobile first design is the only 2019 strategy that will work

New customer acquisition vs. retention: 7 best practices for search

Like nearly all retailers, a large health and beauty organization is facing escalating competition and CPCs on search. The performance marketing team realizes it can’t keep paying heightening costs to acquire the same levels of revenue from repeat customers.

At the same time, the team recognizes it can better coordinate its strategy on other channels. Retargeting, email and direct can work together more cohesively to push customers to purchase once they’re in the door, or back in the door, from search.

They developed a new strategy for tackling Google Ads, one focused on identifying and treating new customers differently than returning customers. The ultimate goal is to achieve more granular return targets for new versus repeat customers, with repeat customers generating a much more efficient return than in the past.

This scenario is not an isolated case. Many performance marketing teams in retail are keen to understand how a new-versus-repeat customer model works for search. Some of the most common questions are: What should we know about this approach? What’s the process to implement it? How would we measure success?

Here are some best practices.

1. Realize the war for the wallet will be won at the top of the funnel

A new-versus-returning customer strategy can make a lot of sense in today’s competitive climate. Here’s why:

  • Retailers can’t fight for the bottom of the funnel anymore. CPCs continue to rise in direct response channels like search. Retailers’ average CPC in Google paid search (text ads) grew by 14% in 2018, reaching $0.71, according to Sidecar’s 2019 Benchmarks Report: Google Ads in Retail. Google Shopping CPC averaged $0.57 in 2018, up by 4%. Competition in search is at a fever pitch. Retailers are moving the battle to the top of the funnel because they’ve realized the downstream benefits it provides to get in front of customers in the research stage.
  • Most retailers own their customers less and less. Consumers have more options than ever in terms of where and when they shop. As a result, most retailers own their customers less and need to work harder and smarter to secure loyalty. With that in mind, consider this: If someone who just purchased from you is now searching for products you sell using generic terms in a competitive space like Google, is that person really your customer? Or is she a prospect you need to re-acquire at the top of the funnel?

Both these realizations speak to the growing importance of the upper funnel. Similarly, acquiring new customers requires you to strengthen the top of your marketing funnel. And strengthening the top, in turn, requires you to shore up the middle and bottom of your funnel, so prospects move forward to conversion.

2. Define what ‘customer’ means to your business

Here’s one of the biggest pitfalls marketers face when developing an audience strategy: They overlook the step of defining what comprises a customer, and how that definition translates to their search campaigns.

That definition can vary greatly among marketing departments. Some define a customer as any visitor who has purchased in the last six months. Others define a customer as a visitor who has purchased at any point in time. Still, others consider a customer to be a returning visitor who is searching only using branded keywords.

Your definition of a customer should align with how you want to treat past purchasers. This thought goes back to the idea that “most retailers own their customers less and less.” If someone bought from you four years ago and hasn’t purchased since, would you still consider him a customer, and treat him the same as someone who bought from you a month ago?

Say two people bought from you yesterday. Theoretically, your brand is still fresh in their heads. But today, one shopper searches for the types of products you offer using a generic term. The other shopper uses a branded term. Would you consider both of them active customers? Or would you say you need to re-acquire the shopper who used the generic term?

Those are some philosophical considerations to help arrive at your definition of a customer. The other factor is data. Analyze your transaction data to identify trends in repurchase cadence. At what point in time does it become highly unlikely that the shopper will return? One month? Three months? A year? More? Those findings can help inform whether it makes sense to define a customer based on time, and what that timing threshold should be.

3. Understand your customers’ purchase path

Search is typically a new customer acquisition channel, and you can find new customers at varying levels of cost. As you move up the funnel within search marketing, it tends to cost more to acquire new customers.

However, if you have a strong understanding of your customers’ purchase path, you ideally know that a heightened cost is justified, because you can see your other channels—like email, affiliates, direct, etc.—are coming into play to nurture customers to purchase.

Gaining this understanding has a lot to do with your attribution model. Having a multi-channel attribution model is essential to viewing performance across your channels—and that also makes it a key best practice with a new-versus-returning customer strategy.

Most retailers’ audiences interact with the brand using multiple channels. A multi-channel attribution model lets you more accurately value the role of those channels. That knowledge can translate into critical information for determining the size of your investment and your ROI goal, channel by channel.

4. Create campaigns supporting each audience segment

Once you’ve defined what a customer means to your business, segment your ad campaigns based on new versus returning customers. This is where features like Remarketing Lists for Search Ads (RLSAs) and Customer Match can come into play.

Here’s an example setup involving these features and several similar ones. Keep in mind, this is just one way to slice it. You might find a version of this approach is better for your business and goals.

  • New and uncookied customers (prospects) – This audience is comprised of shoppers who are uncookied and have never purchased. You can build this campaign without remarketing lists, but you can enhance your prospecting efforts by using tools like similar audiences, in-market audiences, affinity audiences, and demographic targeting.
  • New and cookied customers – This bucket could be comprised of shoppers who visited your site but did not purchase within a certain time frame, such as the past 180 days. Create sets of remarketing lists and adjust bids using audience modifiers in Google Ads. Create lists and set modifiers based on the user’s likelihood of converting (e.g., cart abandoners vs. bounced users). The new and cookied bucket also could include customers who have purchased further back than your specified window (in this example, 180 days), because you might consider this audience to fall back into the “new, yet cookied” category.
  • Returning customers – This encompasses shoppers who’ve purchased within the past 180 days (to continue with the example). You can create this segment with a combination of Customer Match (email lists) and cookied purchasers (users who landed on your order confirmation page). For even more granularity, break these users into segments, such as high lifetime value, dormant, or first-time buyers.

5. Set a unique return goal for each audience segment

Once you’ve developed your audience buckets, determine a unique return goal for each audience. A good return goal should align with the goals of your business and the campaign.

Also, it’s important to note the inherent relationship between return and revenue. Generally, a stricter return goal will limit revenue opportunities, and a more liberal return goal will open revenue opportunities.

For instance, you might be willing to target a less efficient goal for prospects (perhaps 30-45% cost/sale), a similar or slightly more efficient goal for the new and cookied audience (25-40% cost/sale), and a much more efficient goal for returning customers (about 5-10% cost/sale).

Generally, with a new-versus-returning customer model, you should be willing to spend more budget and operate to a less efficient return goal to attract new customers. By contrast, you should target a more efficient goal for returning customers because you’ve already invested in this audience and you’ve determined it is more likely to convert after having purchased in the past.

6. Segment each campaign further to align with your customers’ journey

Once you establish baseline campaigns for new and returning customers, analyze your data to determine if there’s enough volume to segment even further. For instance, do you still have enough data to split each campaign by device? If you know that more users are beginning their purchase journeys on smartphones compared to desktop or tablet, is there further value to be gained by targeting these mobile users differently?

Also consider whether you can segment by branded and non-branded terms, or trademarked and non-trademarked terms. That’s because search terms, naturally, reveal tremendous insight into purchase intent.

A new customer searching “laser printers” is probably at the top of the funnel, while a new customer searching “Brother HL-L2370DW printer” is further along in the funnel. If you have enough traffic hitting each of those two types of terms, consider segmenting by them in your new customer campaign.

The same concept applies to your returning customer campaign. For instance, If you see enough traffic going to generic terms versus branded or trademarked terms, consider creating campaigns for each type of query.

7. Watch for KPIs of success

Some of the most important questions to ask yourself as you evaluate performance are: Are you hitting your return goals? Are new customers aligning with your ideal customer profile? Are you increasing net new customers, while maintaining the same level of profit? Is cost per conversion down for returning customers?

Get in the habit of making incremental tweaks about every three months, depending on the trends arising in your data.

Your growth in search will naturally level off if you don’t innovate. Refresh your view of performance, and rethink the role of search in your performance marketing strategy. Consider whether your business and marketing goals are a fit for a model centered on targeting new versus returning customers.

This story first appeared on Search Engine Land. For more on search marketing and SEO, click here.

https://searchengineland.com/new-customer-acquisition-vs-retention-7-best-practices-for-search-315674


Opinions expressed in this article are those of the guest author and not necessarily Marketing Land. Staff authors are listed here.


About The Author

Steve Costanza is the Senior Analytics Consultant of Enterprise Customer Strategy at Sidecar. He analyzes digital marketing performance and strategic direction for large retailers across verticals, focusing on data visualizations and advanced account segmentation. He is responsible for deriving meaning from numbers and determining how to use those insights to drive marketing decision making. Steve is especially close to Google’s new innovations impacting Shopping and paid search. He has a master’s degree in data analytics and contributes to Search Engine Land as well as Sidecar Discover, the publication by Sidecar that covers research and ideas shaping digital marketing in retail.

Using Python to recover SEO site traffic (Part three)

Using Python to recover SEO site traffic (Part three)

When you incorporate machine learning techniques to speed up SEO recovery, the results can be amazing.

This is the third and last installment from our series on using Python to speed SEO traffic recovery. In part one, I explained how our unique approach, that we call “winners vs losers” helps us quickly narrow down the pages losing traffic to find the main reason for the drop. In part two, we improved on our initial approach to manually group pages using regular expressions, which is very useful when you have sites with thousands or millions of pages, which is typically the case with ecommerce sites. In part three, we will learn something really exciting. We will learn to automatically group pages using machine learning.

As mentioned before, you can find the code used in part one, two and three in this Google Colab notebook.

Let’s get started.

URL matching vs content matching

When we grouped pages manually in part two, we benefited from the fact the URLs groups had clear patterns (collections, products, and the others) but it is often the case where there are no patterns in the URL. For example, Yahoo Stores’ sites use a flat URL structure with no directory paths. Our manual approach wouldn’t work in this case.

Fortunately, it is possible to group pages by their contents because most page templates have different content structures. They serve different user needs, so that needs to be the case.

How can we organize pages by their content? We can use DOM element selectors for this. We will specifically use XPaths.

Example of using DOM elements to organize pages by their content

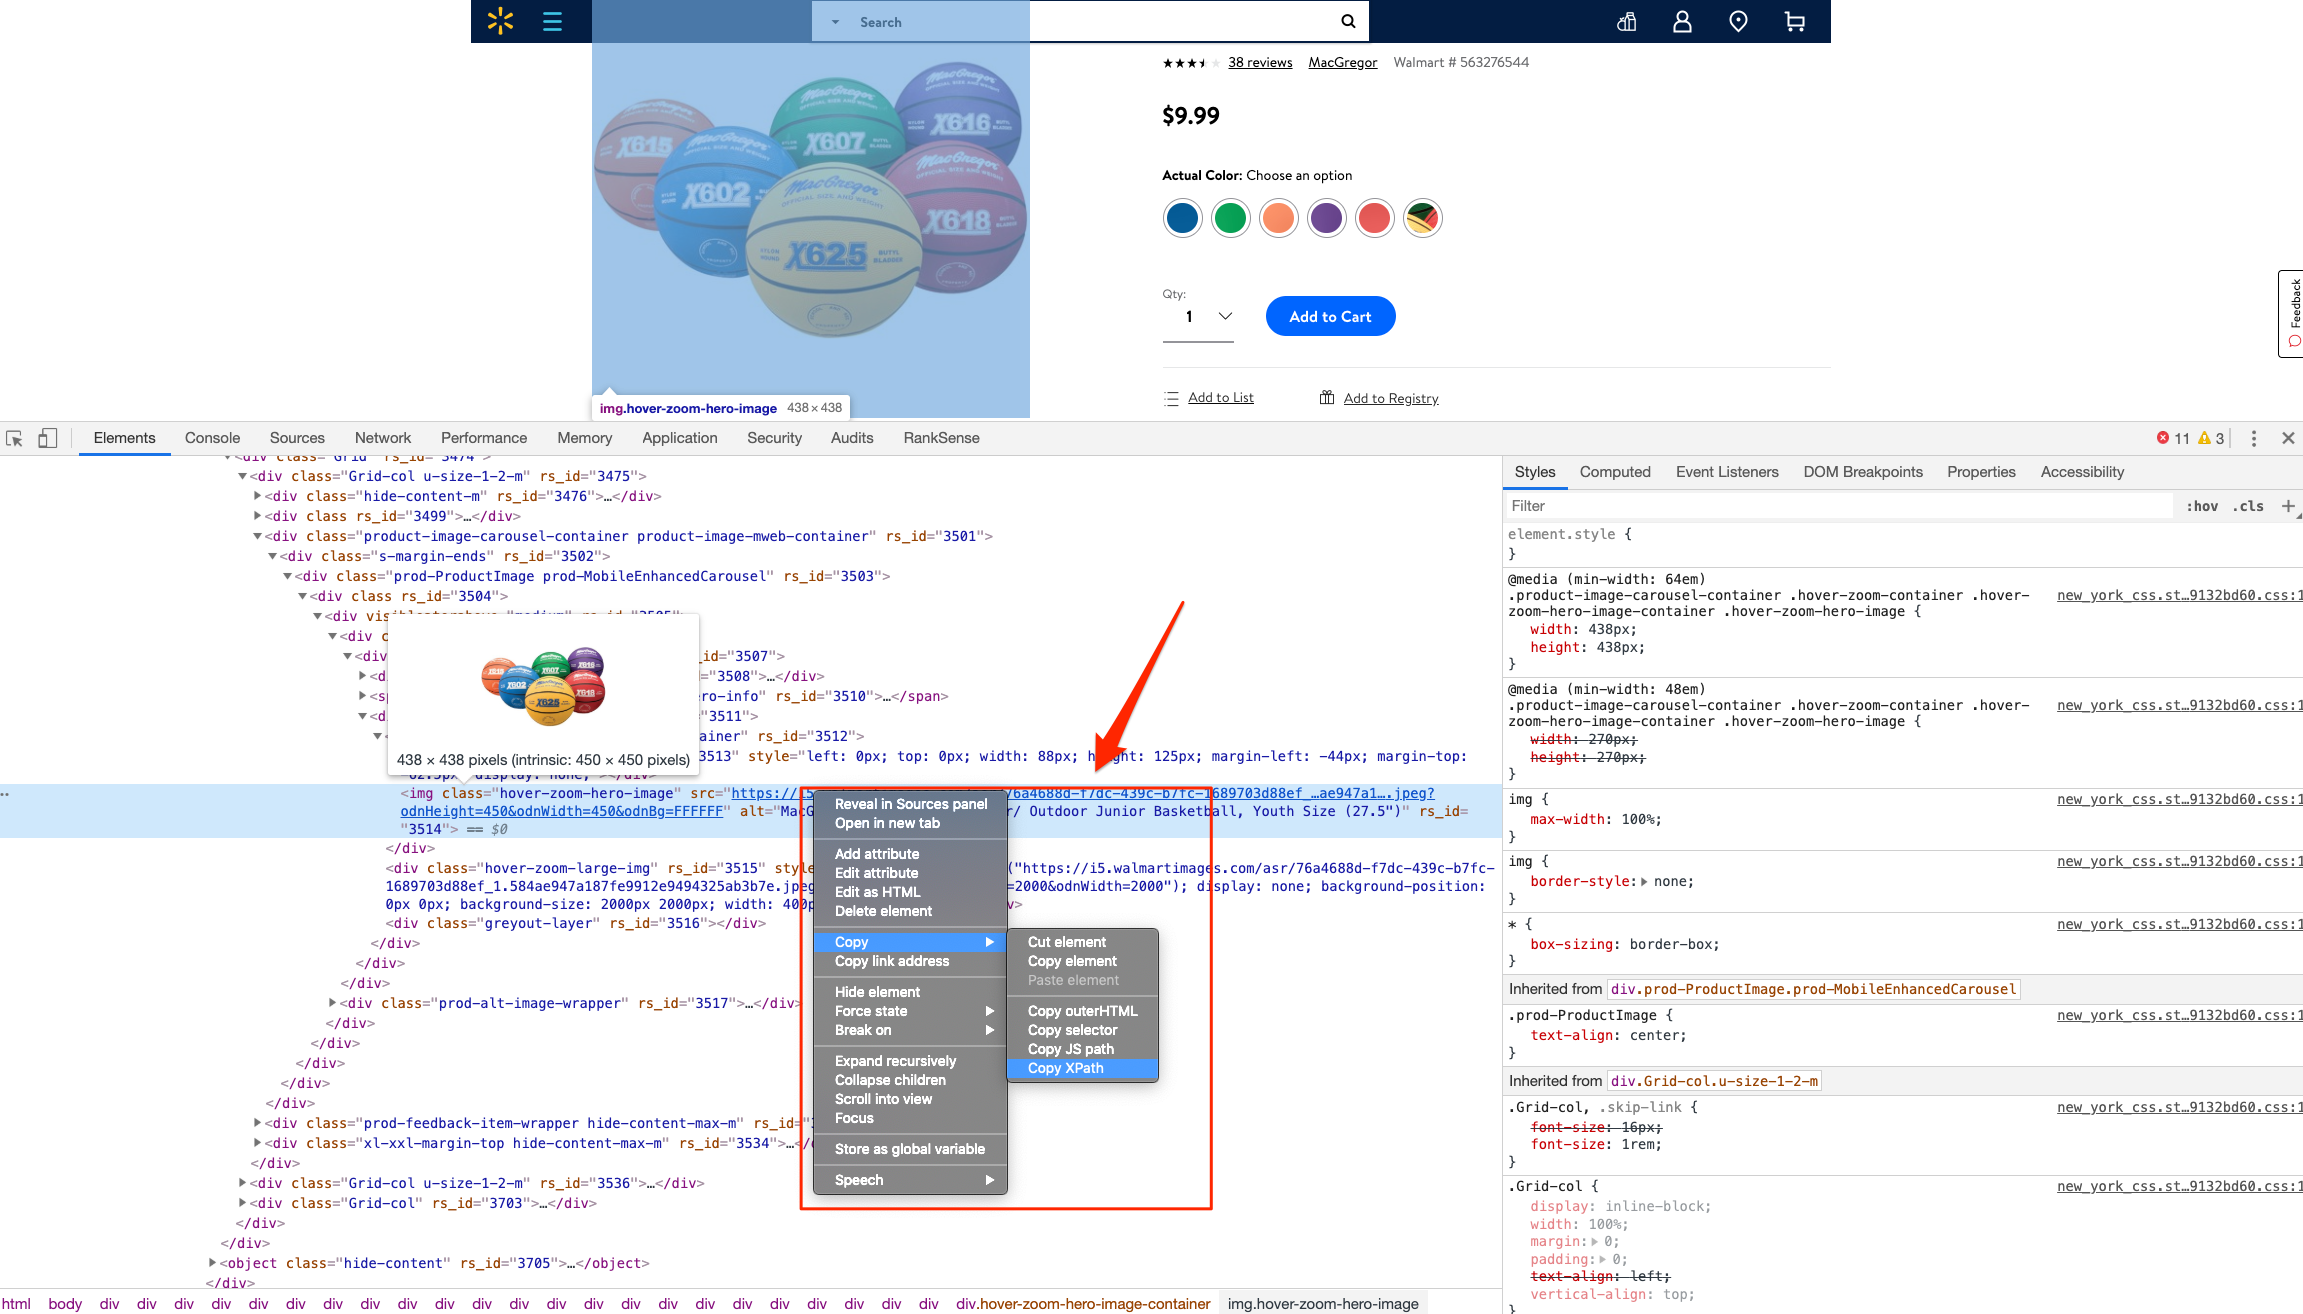
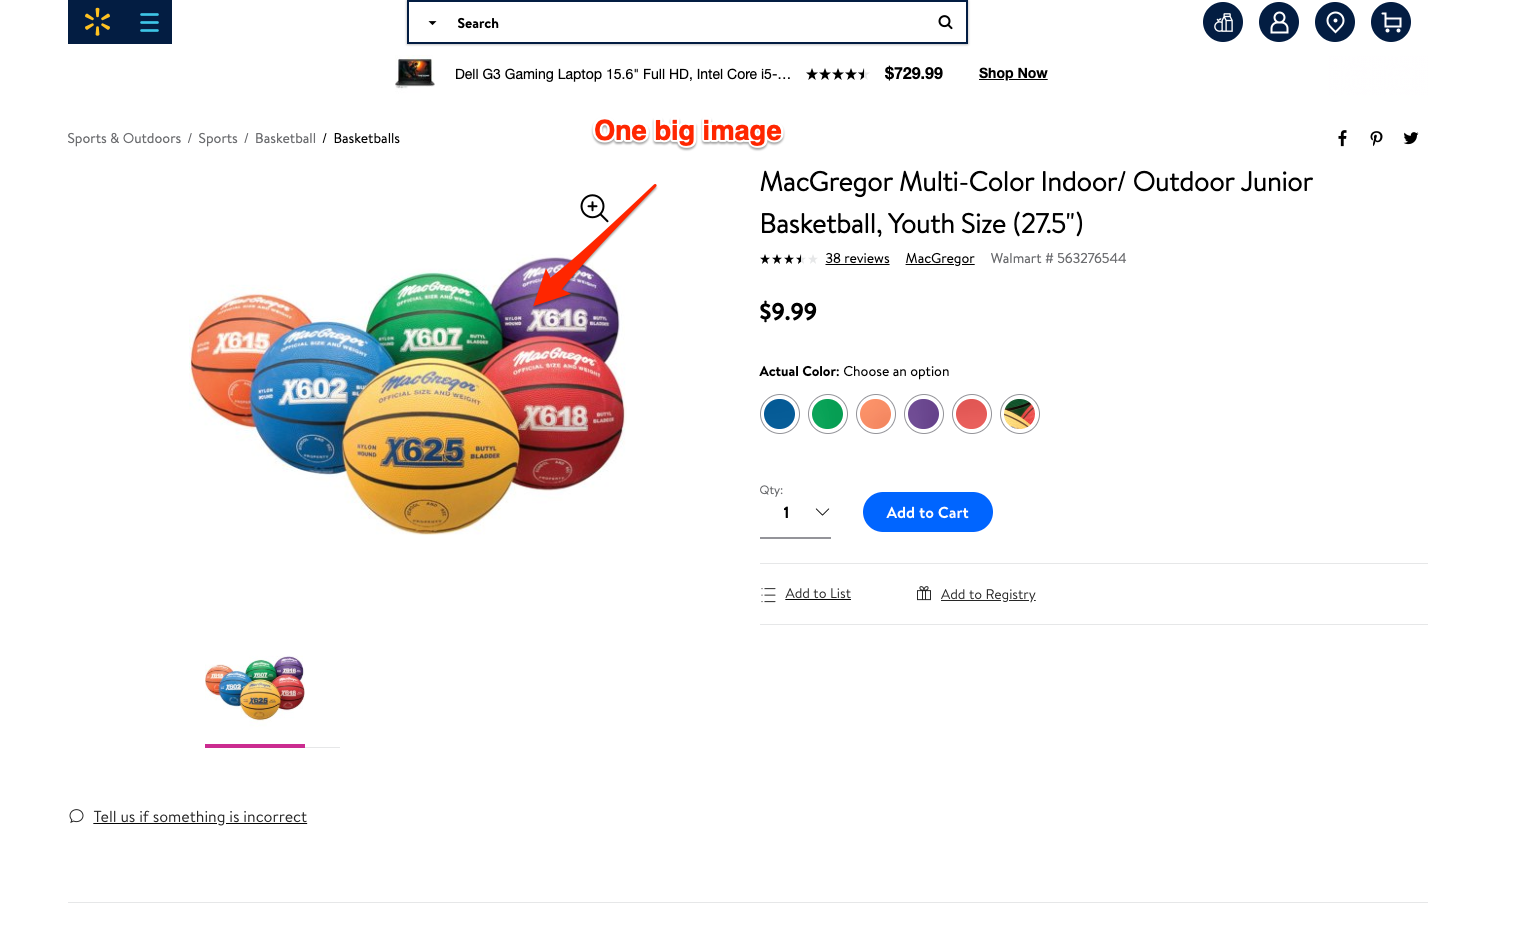
For example, I can use the presence of a big product image to know the page is a product detail page. I can grab the product image address in the document (its XPath) by right-clicking on it in Chrome and choosing “Inspect,” then right-clicking to copy the XPath.

We can identify other page groups by finding page elements that are unique to them. However, note that while this would allow us to group Yahoo Store-type sites, it would still be a manual process to create the groups.

A scientist’s bottom-up approach

In order to group pages automatically, we need to use a statistical approach. In other words, we need to find patterns in the data that we can use to cluster similar pages together because they share similar statistics. This is a perfect problem for machine learning algorithms.

BloomReach, a digital experience platform vendor, shared their machine learning solution to this problem. To summarize it, they first manually selected cleaned features from the HTML tags like class IDs, CSS style sheet names, and the others. Then, they automatically grouped pages based on the presence and variability of these features. In their tests, they achieved around 90% accuracy, which is pretty good.

When you give problems like this to scientists and engineers with no domain expertise, they will generally come up with complicated, bottom-up solutions. The scientist will say, “Here is the data I have, let me try different computer science ideas I know until I find a good solution.”

One of the reasons I advocate practitioners learn programming is that you can start solving problems using your domain expertise and find shortcuts like the one I will share next.

Hamlet’s observation and a simpler solution

For most ecommerce sites, most page templates include images (and input elements), and those generally change in quantity and size.

Hamlet's observation for a simpler approach based on domain-level observationsHamlet's observation for a simpler approach by testing the quantity and size of images

I decided to test the quantity and size of images, and the number of input elements as my features set. We were able to achieve 97.5% accuracy in our tests. This is a much simpler and effective approach for this specific problem. All of this is possible because I didn’t start with the data I could access, but with a simpler domain-level observation.

I am not trying to say my approach is superior, as they have tested theirs in millions of pages and I’ve only tested this on a few thousand. My point is that as a practitioner you should learn this stuff so you can contribute your own expertise and creativity.

Now let’s get to the fun part and get to code some machine learning code in Python!

Collecting training data

We need training data to build a model. This training data needs to come pre-labeled with “correct” answers so that the model can learn from the correct answers and make its own predictions on unseen data.

In our case, as discussed above, we’ll use our intuition that most product pages have one or more large images on the page, and most category type pages have many smaller images on the page.

What’s more, product pages typically have more form elements than category pages (for filling in quantity, color, and more).

Unfortunately, crawling a web page for this data requires knowledge of web browser automation, and image manipulation, which are outside the scope of this post. Feel free to study this GitHub gist we put together to learn more.

Here we load the raw data already collected.

Feature engineering

Each row of the form_counts data frame above corresponds to a single URL and provides a count of both form elements, and input elements contained on that page.

Meanwhile, in the img_counts data frame, each row corresponds to a single image from a particular page. Each image has an associated file size, height, and width. Pages are more than likely to have multiple images on each page, and so there are many rows corresponding to each URL.

It is often the case that HTML documents don’t include explicit image dimensions. We are using a little trick to compensate for this. We are capturing the size of the image files, which would be proportional to the multiplication of the width and the length of the images.

We want our image counts and image file sizes to be treated as categorical features, not numerical ones. When a numerical feature, say new visitors, increases it generally implies improvement, but we don’t want bigger images to imply improvement. A common technique to do this is called one-hot encoding.

Most site pages can have an arbitrary number of images. We are going to further process our dataset by bucketing images into 50 groups. This technique is called “binning”.

Here is what our processed data set looks like.

Example view of processed data for "binning"

Adding ground truth labels

As we already have correct labels from our manual regex approach, we can use them to create the correct labels to feed the model.

We also need to split our dataset randomly into a training set and a test set. This allows us to train the machine learning model on one set of data, and test it on another set that it’s never seen before. We do this to prevent our model from simply “memorizing” the training data and doing terribly on new, unseen data. You can check it out at the link given below:

Model training and grid search

Finally, the good stuff!

All the steps above, the data collection and preparation, are generally the hardest part to code. The machine learning code is generally quite simple.

We’re using the well-known Scikitlearn python library to train a number of popular models using a bunch of standard hyperparameters (settings for fine-tuning a model). Scikitlearn will run through all of them to find the best one, we simply need to feed in the X variables (our feature engineering parameters above) and the Y variables (the correct labels) to each model, and perform the .fit() function and voila!

Evaluating performance

Graph for evaluating image performances through a linear pattern

After running the grid search, we find our winning model to be the Linear SVM (0.974) and Logistic regression (0.968) coming at a close second. Even with such high accuracy, a machine learning model will make mistakes. If it doesn’t make any mistakes, then there is definitely something wrong with the code.

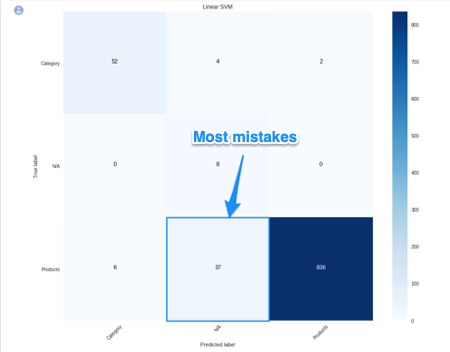
In order to understand where the model performs best and worst, we will use another useful machine learning tool, the confusion matrix.

Graph of the confusion matrix to evaluate image performance

When looking at a confusion matrix, focus on the diagonal squares. The counts there are correct predictions and the counts outside are failures. In the confusion matrix above we can quickly see that the model does really well-labeling products, but terribly labeling pages that are not product or categories. Intuitively, we can assume that such pages would not have consistent image usage.

Here is the code to put together the confusion matrix:

Finally, here is the code to plot the model evaluation:

Resources to learn more

You might be thinking that this is a lot of work to just tell page groups, and you are right!

Screenshot of a query on custom PageTypes and DataLayer

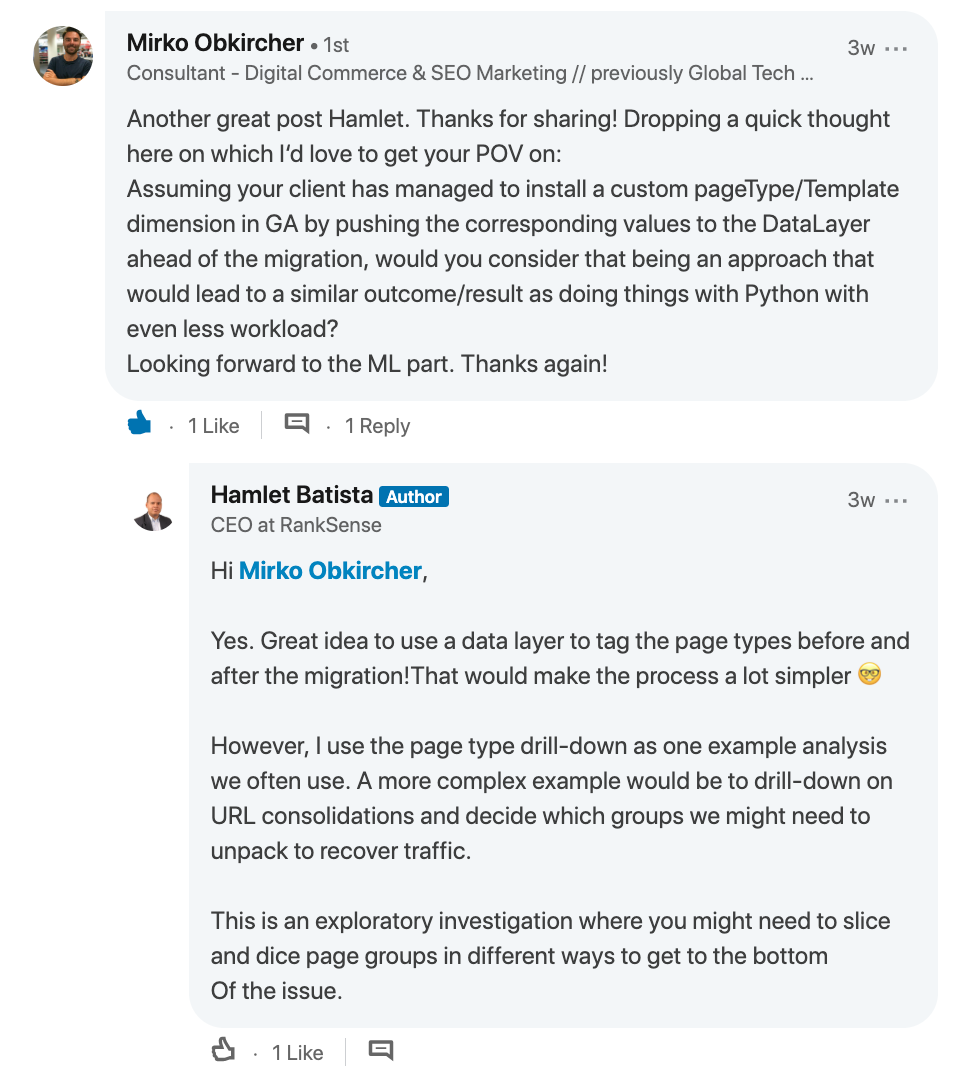
Mirko Obkircher commented in my article for part two that there is a much simpler approach, which is to have your client set up a Google Analytics data layer with the page group type. Very smart recommendation, Mirko!

I am using this example for illustration purposes. What if the issue requires a deeper exploratory investigation? If you already started the analysis using Python, your creativity and knowledge are the only limits.

If you want to jump onto the machine learning bandwagon, here are some resources I recommend to learn more:

Got any tips or queries? Share it in the comments.

Hamlet Batista is the CEO and founder of RankSense, an agile SEO platform for online retailers and manufacturers. He can be found on Twitter .

Related reading

Complete guide to Google Search Console

Google tests AR for Google Maps Considerations for businesses across local search, hyperlocal SEO, and UX

robots.txt best practice guide

How to pick the best website audit tool for your digital agency

MarTech West Overtime: How B2B marketers can reach buying committees at their target accounts

Peter Isaacson, CMO and account-based marketing leader at Demandbase, presented at MarTech West about how to reach buying committees at target accounts. Questions were submitted by attendees around intent, KPIs and the journey of the buying committee and Isaacson took the time to share some insights with us.

How do you use AI – along with intent – to reach the buying committee early?

The goal of all B2B marketing and sales is to reach the buying committee at your target accounts, i.e., the people who will sign off on a purchase and all of the influencers who are going to contribute to the decision. The challenge has been how to identify that buying committee because they are by nature ad hoc, ephemeral and different at every organization. And quite frankly, different for every purchase.

It’s very difficult to identify the buying committee, but technology now allows these people to self-identify themselves. The people who are researching the topics and keywords that are connected to your company are very likely the buyers and influencers you’re trying to reach at your target account. These people are self-identifying themselves as the buying committee- showing interest and intent because of the content they are consuming online.

How do you actually get intent for the account and for the buying committee?

Intent at the account level and intent at the buying committee are very much linked because we are identifying all of the content areas, topics and keywords that individuals are researching across the internet as a whole. The magic (I mean AI and machine learning) is synthesizing all of this data, and connecting the topic areas to the value proposition of your company. Each of the individuals is connected to an account, giving us both individual-level intent and account level intent.

For instance, at Demandbase, we are very interested in any keywords or topic areas around Account-Based Marketing, website personalization, digital personalization and marketing customization. We take individuals that are researching those types of keywords and we combine all of those individuals at a particular company into a full account identification. If there are three or four – or 15 – people at a specific company who are researching topics or keywords associated with a specific company, we’ll combine those into a holistic look at the full company and identify that as an account that is showing strong intent. This gives us intent for both the buying committee because they’re self-identifying by actually doing the research on these topic areas and at the account level because an aggregate of these people from the same company shows they are all researching common topic areas.

How do you advertise in the anonymous buyer journey?

B2B marketers understand that waiting until the hand raise or someone fills out a form is too late in the buyer’s journey to start marketing to someone, as most of the research and investigation has already occurred by then. Likewise, it’s even too late in the process to wait until they show up the first time at your website to evaluate or consume different content. By then, they have likely already researched on the outside web and, very likely, have been to at least one – if not a few – of your competitors’ websites.

You need to reach buyers at the very earliest stages of their research. The first sign of intent that you can measure is when they’re starting to do some research on the broader web on areas that are connected to your company’s value proposition. At that point, they’re still anonymous. They haven’t identified themselves and they’re probably going to be anonymous for the next several weeks – if not few months – before they finally click on a button and say “show me a demo” or “I’d like to talk to a sales rep” or “sign me up for a webinar.” But just identifying these individuals demonstrating intent is not enough – you need actually to trigger a marketing activity, like advertising. So your intent identification needs to be integrated into an account-based DSP that can execute ads against these individuals and accounts.

You define the KPIs for modern advertising as 90% of target accounts reached, 30% of target accounts engaging on site, and $15-$300 per account engaged on site. How did you determine these metrics, how often are companies achieving them and what can they do to ensure they’re hitting these KPIs?

When it comes to advertising, B2B marketers have been sold metrics that have nothing to do with business impact for a B2B marketer. They are told they should focus on CPMs, and purchase inventory as cheaply as they possibly can. Focus on click-through-rates, even if those clicks have absolutely zero chance of buying your products. This is often why marketers lose credibility with their C-level peers. Chief Revenue Officers and CEOs don’t care about CPM’s or click-through-rates but publishers and adtech vendors push this because they are the only metrics they can sell.

As B2B marketers, and Account-Based Marketers specifically, we should care about what percentage of our target accounts are actually engaging with our content, which of our target accounts are making it onto our website and what percentage of those target accounts that saw the advertising are making it a pipelined business.

When it comes to the benchmarks mentioned in the question, if you’re below those benchmarks, you should reevaluate, but in most cases marketers should be striving to reach those KPIs. More and more marketers are focused on business impact, but I still talk to a lot of folks who are obsessed with CPMs and click-through-rates. For CPM’s, getting the cheapest advertising that you can is somewhat akin to buying all you can eat sushi. It’s a great deal in terms of getting a ton of fish for a low price, but is it something you want to eat? Absolutely not. It’s the same with CTR’s. Why are marketers obsessed with a .02 vs. a .03 CTR? It really doesn’t matter if people who are never going to buy your products are clicking on your ads. We shouldn’t be obsessed with that. Rather, we should be focused on whether the right company – and the right people at the right company – see our ads, and whether they taking action on those ads.

This story first appeared on MarTech Today. For more on marketing technology, click here.

https://martechtoday.com/martech-west-overtime-how-b2b-marketers-can-reach-buying-committees-at-their-target-accounts-232870


Opinions expressed in this article are those of the guest author and not necessarily Marketing Land. Staff authors are listed here.


About The Author

Peter Isaacson has over 25 years of marketing experience in both B2B and B2C marketing, ranging from branding, advertising, corporate communications and product marketing on a global scale. As CMO for Demandbase, Peter is responsible for overall marketing strategy and execution, including product, corporate and field marketing. Prior to joining Demandbase, Peter was CMO at Castlight Health, helping to scale the company and build the marketing team prior to its successful IPO. Peter got his start in advertising, working at agencies in New York on accounts ranging from Procter & Gamble to Compaq computers.

Study: How ready are businesses for voice search?

“So… most businesses know about voice search. But has this knowledge helped them optimize for it?”

An interesting report recently released by Uberall sought to address that exact question. For as much as we talk about the importance of voice search, and even how to optimize for it — are people actually doing it?

In this report, researchers analyzed 73,000 business locations (using the Boston Metro area as their sample set), across 37 different voice search directories, as well as across SMBs, mid-market, and enterprise.

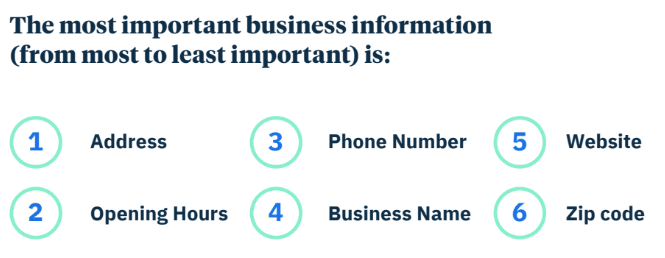
They looked at a number of factors including accuracy of address, business hours, phone number, name, website, and zip code, as well as accuracy across various voice search directories.

In order, this was how they weighted the importance of a listing’s information:

the most important business information to optimize for voice search

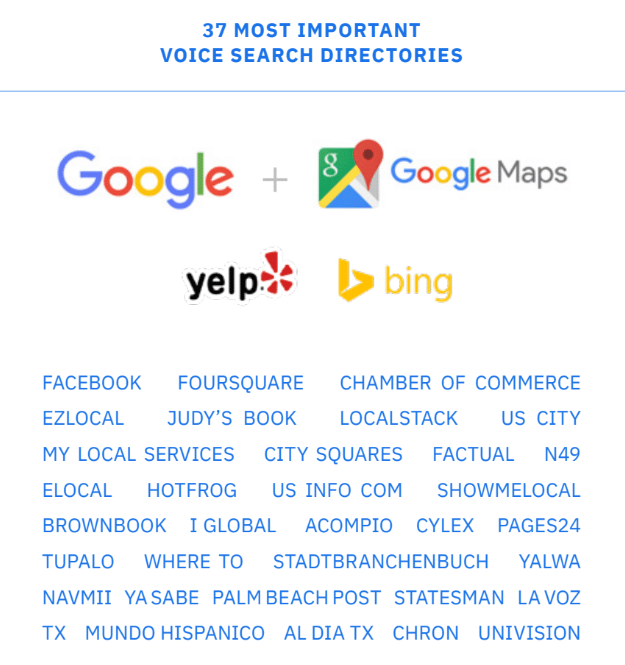
And pictured below are “the 37 most important voice search directories” that they accounted for.

Uberall analysts did note, however, that Google (search + maps), Yelp, and Bing together represent about 90% of the score’s weight.

the 37 most important voice search directories

How ready are businesses for voice search?

The ultimate question. Here, we’ll dive into a few key findings from this report.

1. Over 96% of all business locations fail to list their business information correctly

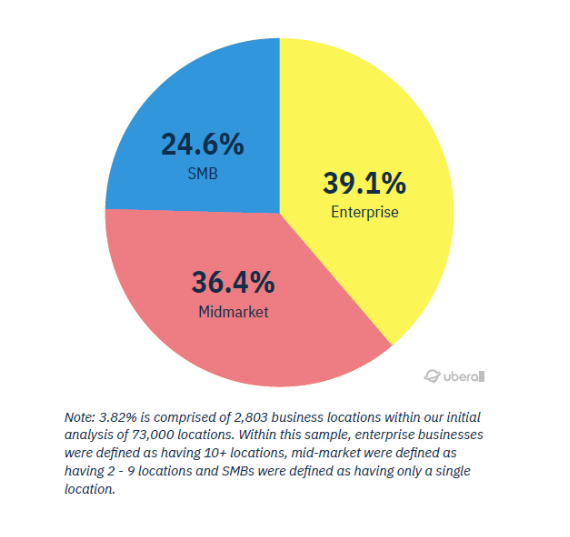
When looking just at the three primary listings locations (Google, Yelp, Bing), Uberall found that only 3.82% of business locations had no critical errors.

In other words, more than 96% of all business locations failed to list their business information correctly.

Breaking down those 3.82% of perfect business location listings, they were somewhat evenly split across enterprise, mid-market, and SMB, with enterprise having the largest share as one might expect.

only 3.82% of business locations had no critical errors, breakdown according to size

2. The four most common types of listing errors

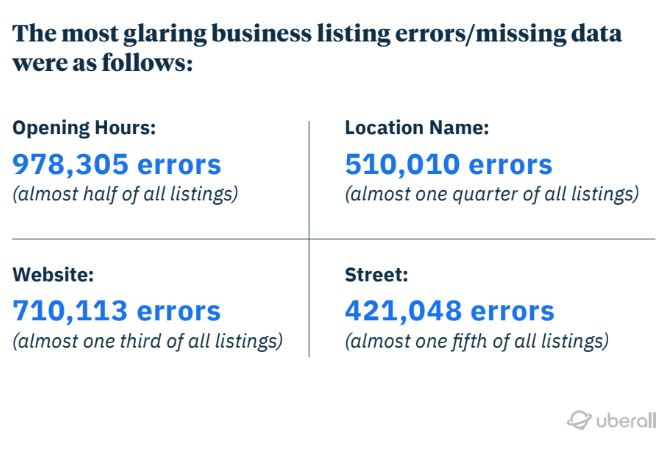
In their analysis, here’s the breakdown of most common types of missing or incorrect information:

  • Opening hours: 978,305 errors (almost half of all listings)
  • Website: 710,113 errors (almost one-third of all listings)
  • Location name: 510,010 errors (almost one-quarter of all listings)
  • Street: 421,048 errors (almost one-fifth of all listings)

the most glaring business listing errors and missing data

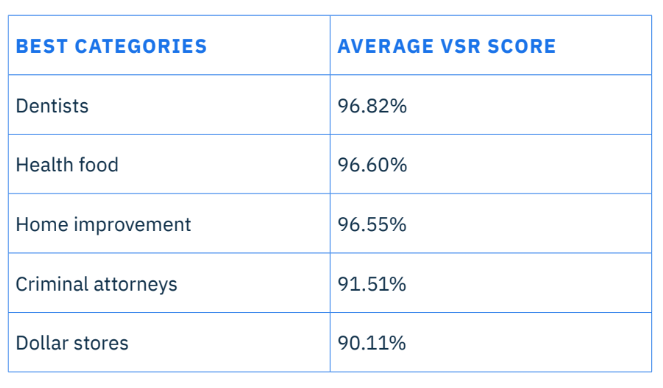
3. Which types of businesses are most likely to be optimized for voice search?

industries that are most voice search ready

Industries that were found to be most voice search ready included:

  • Dentists
  • Health food
  • Home improvement
  • Criminal attorneys
  • Dollar stores

Industries that were found to be least voice search ready included:

  • Consumer protection organizations
  • Congressional representatives
  • Business attorneys
  • Art galleries
  • Wedding services

Not much surprise on the most-prepared industries relying heavily on people being able to find their physical locations. Perhaps a bit impressed that criminal attorneys landed so high on the list. Surprising that art galleries ranked second to last, but perhaps this helps explain decline in traffic of late.

And as ever, we can be expectedly disappointed by the technological savvy of congressional representatives.

What’s the cost of businesses not being optimized for voice search?

The next question, of course, is: how much should we care? Uberall spent a nice bit of their report discussing statistics about the history of voice search, how much it’s used, and its predicted growth.

Interestingly, they also take a moment to fact check the popular “voice will be 50% of all search by 2020” statistic. Apparently, this was taken from an interview with Andrew Ng (co-founder of Coursera, formerly lead at both Google Brain and Baidu) and was originally referring to the growth of a combined voice and image search, specifically via Baidu in China.

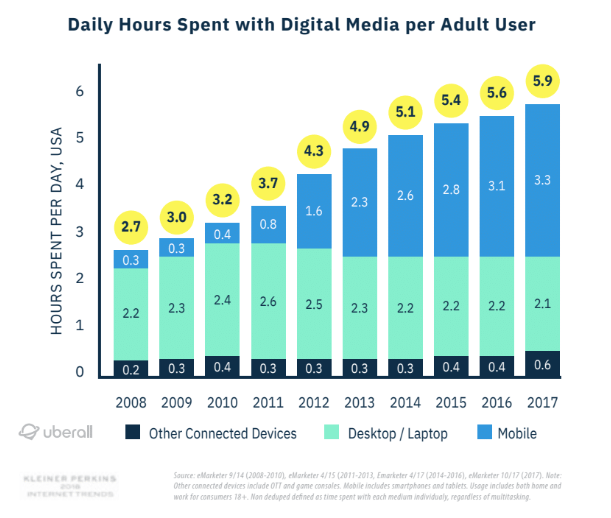
1. On average, adults spend 10x more hours on their phones than they did in 2018

This data was compiled from a number of charts from eMarketer, showing overall increase in digital media use from 2008 to 2017 (and we can imagine is even higher now). Specifically, we see how most all of the growth is driven just from mobile.

The connection here, of course, is that mobile devices are one of the most popular devices for voice search, second only perhaps to smart home devices.

graph daily hours spent with digital media per adult user 2008-2017

2. About 21% of respondents were using voice search every week

According to this study, 21% of respondents were using voice search every week. 57% of respondents said they never used voice search. And about 14% seem to have tried it once or twice and not looked back.

In general, it seems people are a bit polarized — either it’s a habit or it’s not.

over the last year, how often have you used voice search?

Regardless, 21% is a sizable number of consumers (though we don’t have information about how many of those searches convert to purchases).

And it seems the number is on the rise: the recent report from voicebot.ai showed that smart speaker ownership grew by nearly 40% from 2018 to 2019, among US adults.

Overall, the cost of not being optimized for voice search may not be sky high yet. But at the same time, it’s probably never too soon to get your location listings in order and provide accurate information to consumers.

You might also like:

Related reading

Bing takes over Yahoo ad delivery Five things to prepare

robots.txt best practice guide

how to increase conversions: ideas, tools, and examples

content formats proven to maximize link acquisition for digital pr

Collection of tech companies support changes to CA privacy act that bring it closer to GDPR

The California Consumer Privacy Act (CCPA) is set to take effect next year and is likely to become the de facto national privacy standard for online publishers and marketers. Ahead of this deadline, however, competing groups are lobbying for changes in its terms.

AB 1760 looks more like GDPR. A recently proposed amendment in the California legislature (AB 1760) would make major changes to CCPA, effectively repealing and replacing it with something that imposes stricter obligations on companies and has more teeth — much more consistent with Europe’s GDPR. It would allow an additional year for implementation and not go into effect until January 2021 (proposed amendment embedded below).

A group of 23 technology companies, lead by DuckDuckGo, has submitted a letter in support of the changes. The bulk of the signatories are not household names. Major internet companies, many of whom oppose CCPA in its existing form, did not sign the letter.

Proposed changes make the law tougher. Below are some of the major proposed changes to CCPA at a high level:

  • The name would change from CCPA to “Privacy for All Act of 2019” (PAA) and delay the effective date of the law until January 1, 2021, to allow more time for preparation and compliance.

  • CCPA has an opt-out consent framework; that would change to opt-in for personal data sharing. The new rules would prevent companies from sharing or selling a consumer’s personal data without prior authorization.

  • It carries tougher disclosure obligations for companies. For example, businesses would need to disclose specific pieces of personal data (as opposed to categories) as well as the specific third parties that are receiving the data.

  • Consumers that exercise their rights cannot be refused access to services or charged different prices. Conversely, this raises a question about whether companies could offer incentives for data sharing (e.g., discounts).

  • Companies could not refuse a consumer request to delete personal information from their databases. There could only be delays for permissible reasons under the statute. Significantly, business would be required to delete all data related to that consumer in their possession regardless of how it was acquired (first party vs. third party).

  • Data retention rules would look much more like GDPR: only what’s reasonably necessary for the stated use case.

  • There are a range of stronger enforcement provisions and consumer legal remedies, increasing potential liability for violations.

Why you should care. It’s not yet clear whether the amendment will pass. However, if it does a tough law will get even tougher and effectively create a GDPR-like framework for personal data in the U.S. Congressional action that could pre-empt the California law is unlikely before the 2020 election. (As more people find out about AB 1760, pressure will mount for Congress to act.)

GDPR is a year old this May. It has not proven to be the data cataclysm that many feared. Accordingly, companies shouldn’t panic about CCPA or AB 1760 but educate themselves about the existing California privacy rules and the proposed amendment. If the latter comes to pass there will be an additional year to get ready, which almost nobody is doing right now anyway.

Companies that went through the GDPR compliance process will be in a much stronger position than those that did not. And unless Congress enacts new privacy legislation (unlikely), the California law(s) will be unavoidable.

This story first appeared on MarTech Today. For more on marketing technology, click here.

https://martechtoday.com/collection-of-tech-companies-support-changes-to-ca-privacy-act-that-bring-it-closer-to-gdpr-232815


About The Author

Greg Sterling is a Contributing Editor at Search Engine Land. He writes a personal blog, Screenwerk, about connecting the dots between digital media and real-world consumer behavior. He is also VP of Strategy and Insights for the Local Search Association. Follow him on Twitter or find him at Google+.

Three fundamental factors in the production of link-building content

Three fundamental factors in the production of link-building content

One of the most overused phrases in content marketing is how it is an ever-changing landscape, forcing agencies and marketers to adapt and improve their existing processes.

In a short space of time, a topic can go from being newsworthy to negligible, all while certain types of content become tedious to the press and its readers.

A vast amount of the work we do — at Kaizen and many other similar agencies — is create content with the sole purpose of building high authority links, making it all the more imperative that we are conscious of the changes and trends outlined above.
If we were to split the creative process into three sections — content, design, and outreach strategy — how are we able to engineer our own successes and failures to provide us with a framework for future campaigns?

Three important factors for producing link-worthy content

Over the past month, I’ve analyzed over 120 pieces of content across 16 industries to locate and define the common threads between campaigns that exceed or fall short of their expectations. From the amount of data used and visualized to the importance of effective headline storytelling, the insight is a way of both rationalizing and reshaping our approach to content production.
1. Not too much data — our study showed an average of just over five metrics

Behind every great piece of content is (usually) a unique or noteworthy set of data. Both static and interactive content enables us to display limitless amounts of research which provide the origins of the stories we try to communicate. However many figures or metrics you choose to visualize, there is always a point where a journalist or reader switches off.

This glass ceiling is difficult to pinpoint and depends on the type of content, and the industry or readership you’re looking to appeal to, but a more granular study of good and poor performing campaigns that I performed suggested some benefits of refining data sets.

Observations

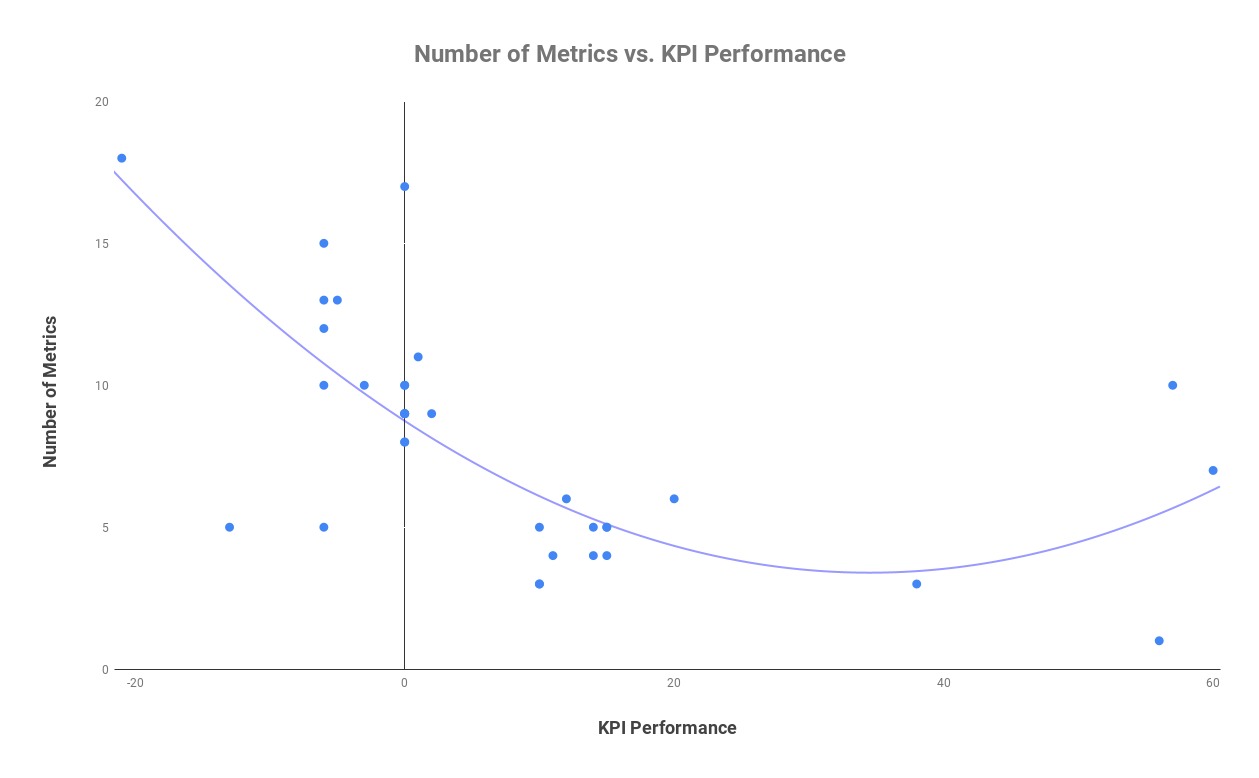
A starting point for any piece of research is the individual metrics, whether it is cost, type, or essentially anything worth measuring and comparing. In my research, in the content campaigns that exceed our typical KPI, there was an average of just over 5 metrics used on each piece compared to almost double in campaigns with either a normal or below satisfactory performance. The graph below shows the correlation between a lower number of metrics and a higher link performance.

Graph of various metrics and high link performance

An example of these findings in practice can be found in an infographic study completed for online travel retailer Lastminute.com that sought to find the world’s most chilled out countries. Following a comprehensive study of 36 countries across 10 metrics, the task was to refine these figures in a way that can be translated well through its design. The number of countries was whittled down to just the top 15, and the metrics were condensed to have four indexes which the rankings were based on. The decision to not showcase the data in its entirety proved fruitful, securing over 50 links, covered by the Mail Online and Lonely Planet.

As an individual who very much enjoys partaking in the research process, it can be extremely difficult to sacrifice any element of your work, but it is that level of tact in the production of content that distinguishes one piece from another.

2. Simple, powerful data visualizations — our analysis showed highest achievers had just one visualization

Regardless of how saturated the content marketing industry becomes, we are graced every year with new and innovative ways of visualizing data. The balancing act between originality in your design and an unnecessarily complex data-visualization is often the point on which success and failure can pivot. As is the case with data, overloading a piece of content with an amass of multi-faceted graphs and charts is a surefire way of alienating your users, leaving them either bored or confused.

Observations

For my study, I decided to look at the content that contained data visualizations that failed to hit the mark and see whether the quality is as much of a problem as quantity in terms of design. As I carried out the analysis, I denoted the two examples where one visual would incorporate most or all of the study, or the same illustration was replicated several times for a country, region or sector. For instance, this study, from medical travel insurance provider Get Going, on reliable airlines condenses all the key information into one single data-visualization. Conversely, this piece from The Guardian on the gender pay gap shows how it can be effective to use one visual several times to present your data.     

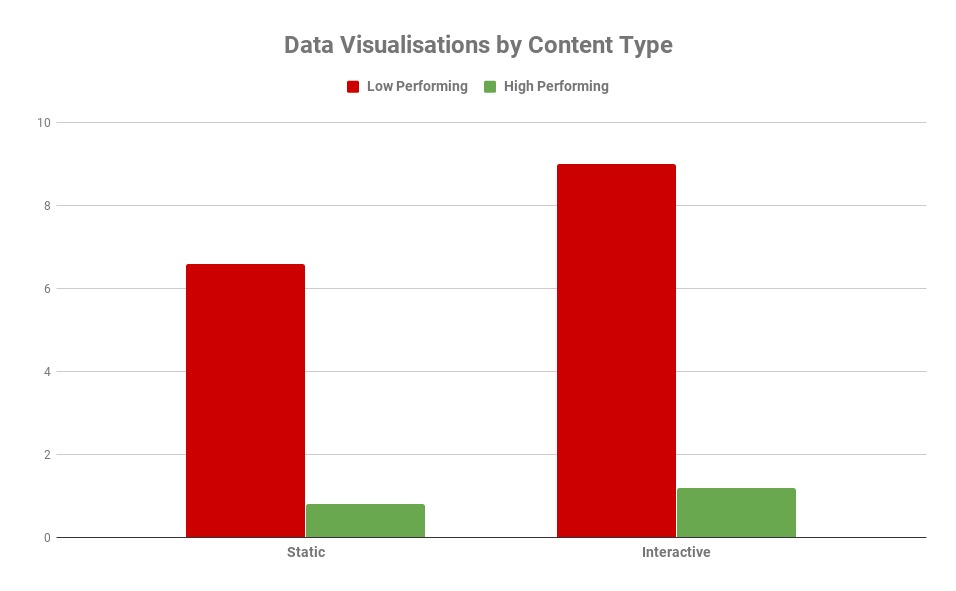
Unsurprisingly, many of the low scorers in my research averaged around eight different forms of data visualizations while high achievers contained just one. The graph below showcases how many data-visualizations are used on average by high and low performing pieces, both static and interactive. Low performing static examples contained an average of just over six, with less than one for their higher-scoring counterparts. For interactive content, the optimum is just over one with poor performing content containing almost nine per piece.

Graph on analyzing the performance of static and interactive content types

In examples where the same type of graph or chart was used repeatedly, poor performers had approximately 33 per piece, with their more favorable counterparts using just three.

It is important to note that ranking-based pieces often require the repetition of a visual in order to tell a story, but once again this is part of the balancing act for creatives in terms of what type and how many data-visualizations one utilizes.

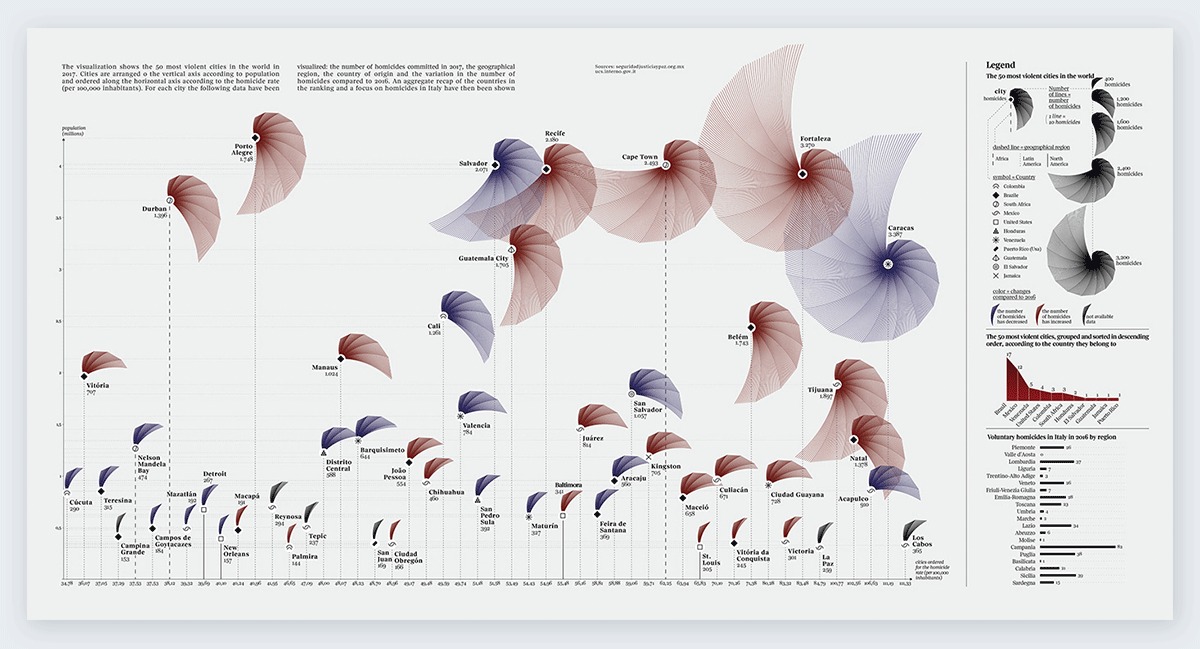
A fine example of an effective illustration of the data study contained in one visual comes from a 2017 piece by Federica Fragapane for Italian publication La Lettura, showcasing the most violent cities in the world. The chart depicts each city as a shape sized by its homicide rate, with other small indicators defined in the legend to the right of the graphic. The aesthetic qualities of the graph give a campaign, fairly morbid in the topic, an extended appeal beyond the subject of just global crime. While the term “design-led” is so-often thrown around, this example proves how effective it can be to integrate visuals effectively through your data. The piece, produced originally for print, proved hugely successful in the design space, with 18 referring domains from sites such as Visme.co.

An example graph of integrating visuals effectively through data

3. Pandering to the press — over a third of our published links used the same headline as our pitch email subject line

Kaizen produces hundreds of campaigns on a yearly basis across a range of industries, meaning the task of looking inward is as necessary today as it ever has been. Competition means that press contacts are looking for something extra special to warrant your content’s publication. While ingenuity is required in every area of content marketing, it’s equally important to recognize the importance of getting the basics right.

The task of outreach can be won and lost in several ways, but your subject line is, and will always be, the most significant component of your pitch. Whether you encapsulate your content in a single sentence or highlight your most attention-worthy finding, an email headline is a laborious but crucial task. My task through my research was to find how vital it is in terms of the end result of achieving coverage.

Observations

As part of my analysis, I recorded the backlinks of a sample of our high and average content and recorded the headlines used in the coverage for each campaign. I found in better-performing examples, over a third of links used the same headlines used in our pitch emails, emphasizing the importance of effective storytelling in every area of your PR process. Below is an illustration in the SERPs of how far an effective headline can take you, with example coverage from one of our most successful pieces for TotallyMoney on work/life balance in Europe.

Example of effective headlines for high-link performance

Another area I was keen to investigate, given the time and effort that goes into it, is how press releases are used across the coverage we get. Using scraping software, I was able to pull out the copy from each article where a follow link was achieved and compare it to the press releases we have produced. It was pleasing to see that one in five links contained at least a paragraph of copy used in our press materials. In contrast, just seven percent of the coverage within the lower performing campaigns contained a reference to our press releases, and an even lower four percent using headlines from our email subject lines.

Final thoughts

These correlations, similar to the ones discussed previously, suggest not only how vital the execution of basic processes are, but serve as a reminder that a campaign can do well or fall down at so many different points of production. For marketers, analysis of this nature indicates that a refinement of creative operations is a more secure route for your content and its coverage. Don’t think of it as “less is more” but a case of picking the right tools for the job at hand.

Nathan Abbott is Content Manager at Kaizen.

Related reading

international insight from google analytics

how to make SEO-friendly Javascript websites

Complete guide to Google Search Console

Google tests AR for Google Maps Considerations for businesses across local search, hyperlocal SEO, and UX