Tuesday, November 24, 2020
To help website owners better understand how Googlebot crawls their sites, we’re launching a brand new version of the Crawl stats report in Search Console.
The new Crawl Stats report brings the following exciting new features:
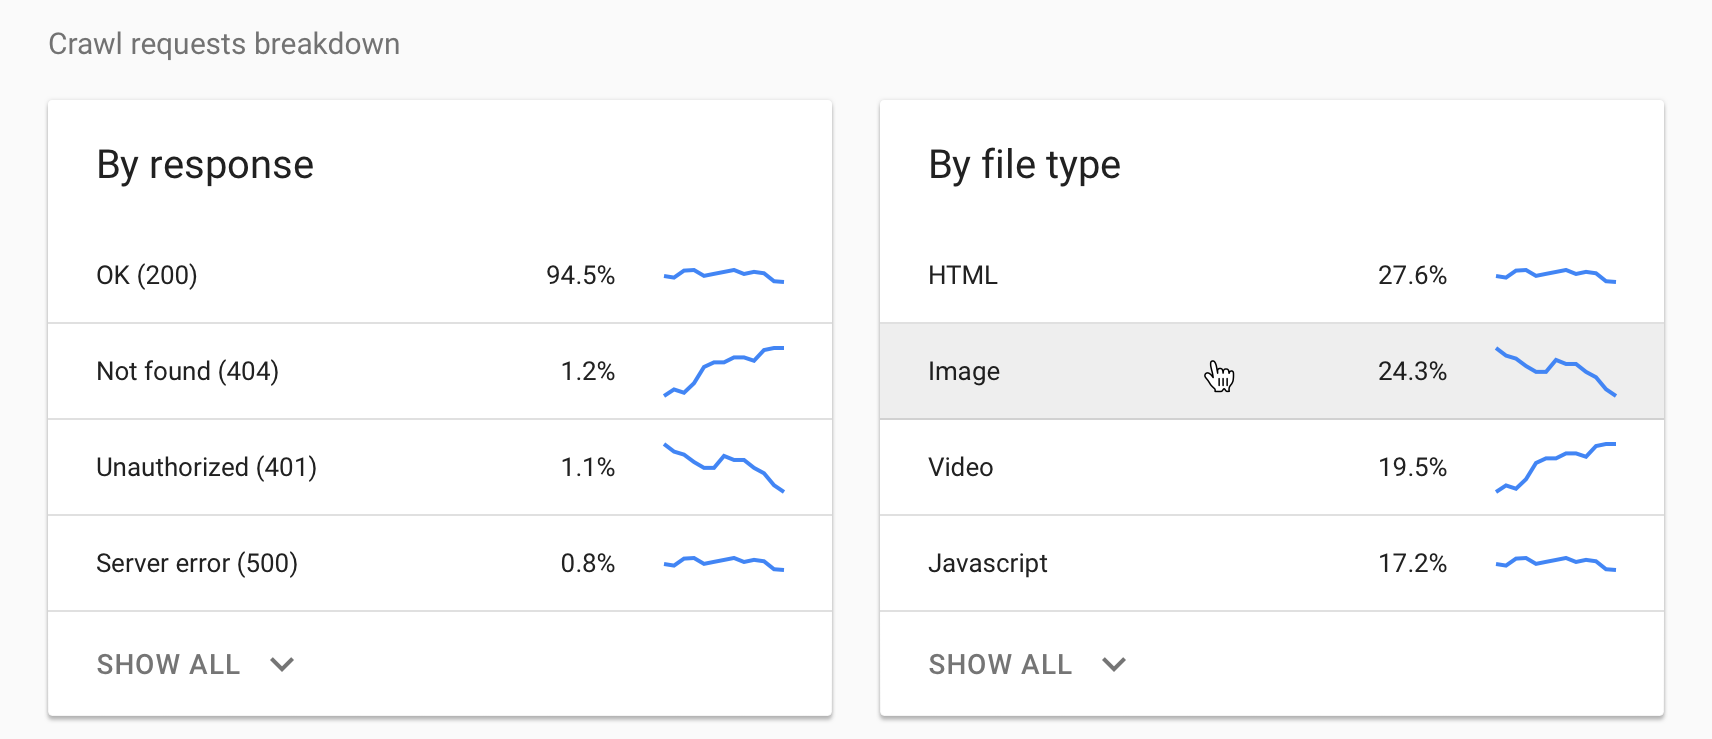
- Total number of requests grouped by response code, crawled file type, crawl purpose, and Googlebot type.
- Detailed information on host status
- URL examples to show where in your site requests occurred
- Comprehensive summary for properties with multiple hosts and support for domain properties
Over-time charts
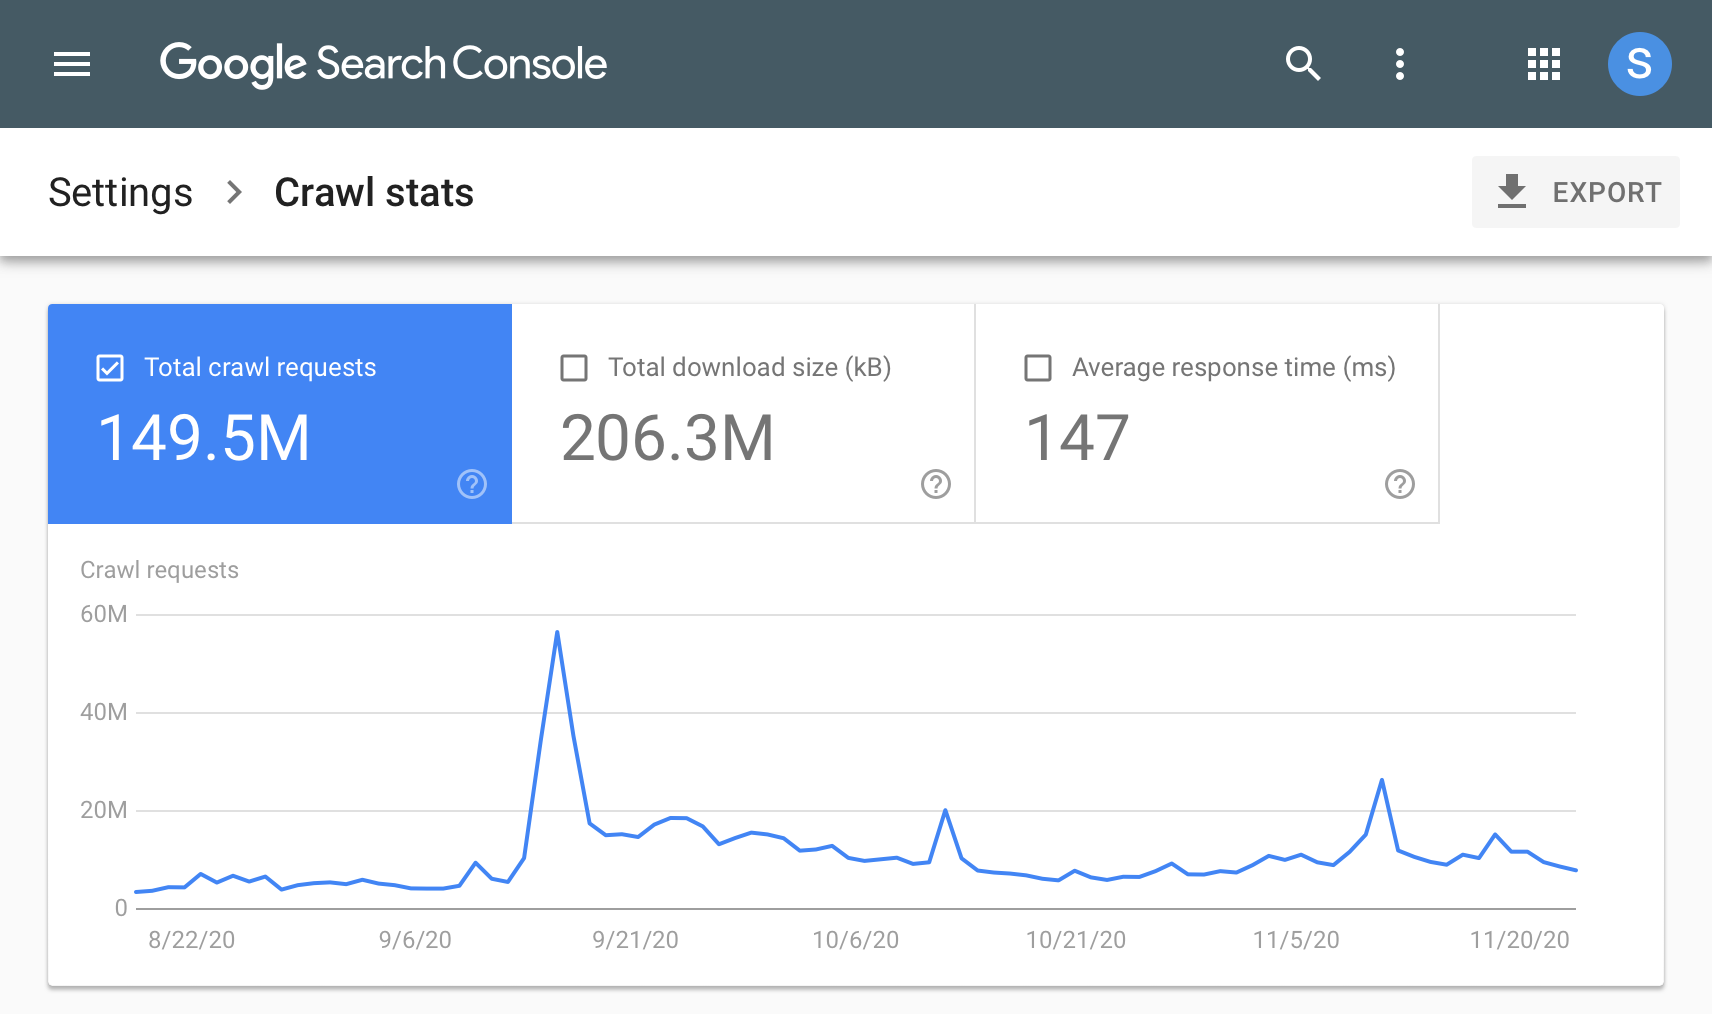
The Crawl Stats report enables website owners to see Google crawl data totals and overtime charts for: total requests, total download size and average response time.

Grouped crawl data
The new version of the report also provides data on crawl requests broken down by response, file type of the fetched URL, purpose of the crawl request, and Googlebot agent. See example URLs of each type by clicking on a row in the grouping table:

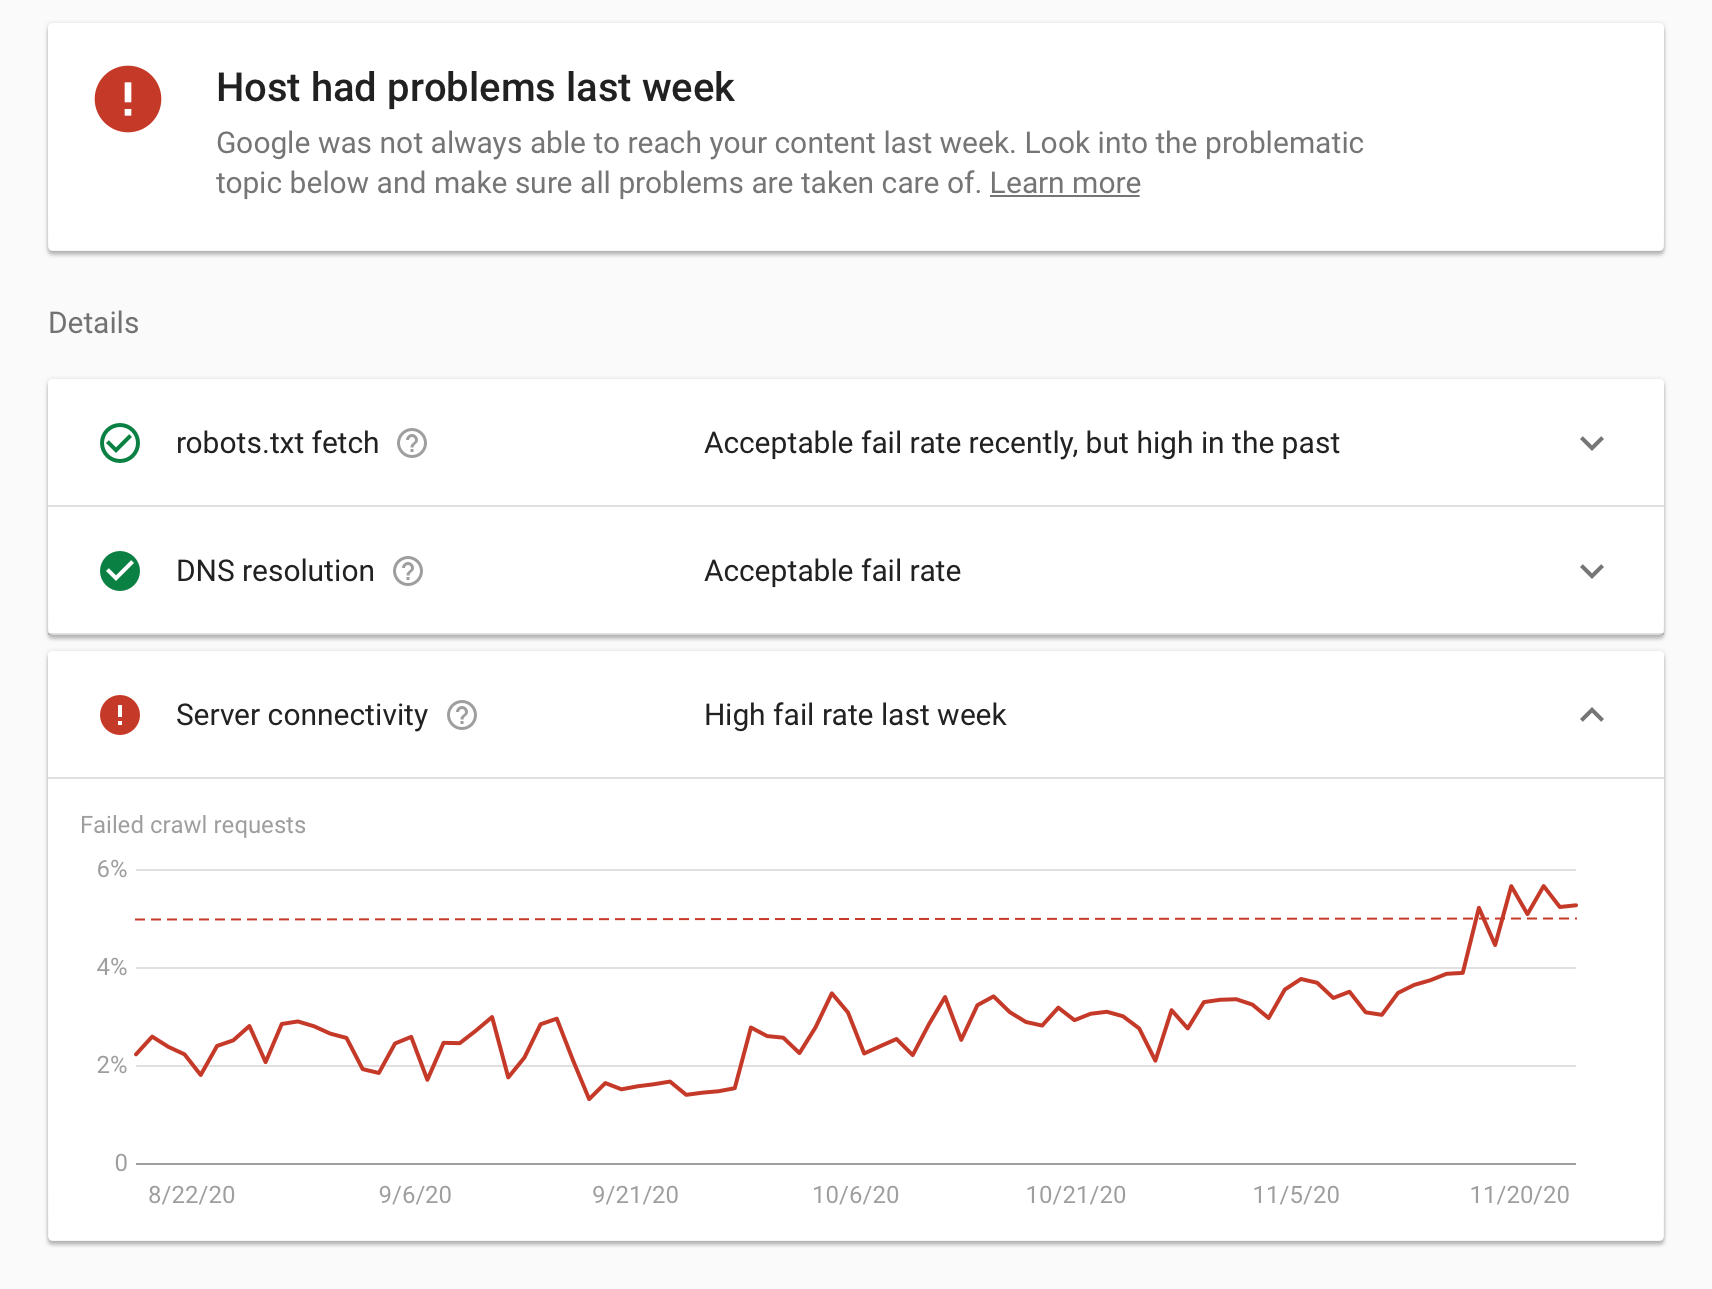
High level & detailed information on host status issues
Host status details in the report let you check your site’s general availability to Google in the last 90 days.

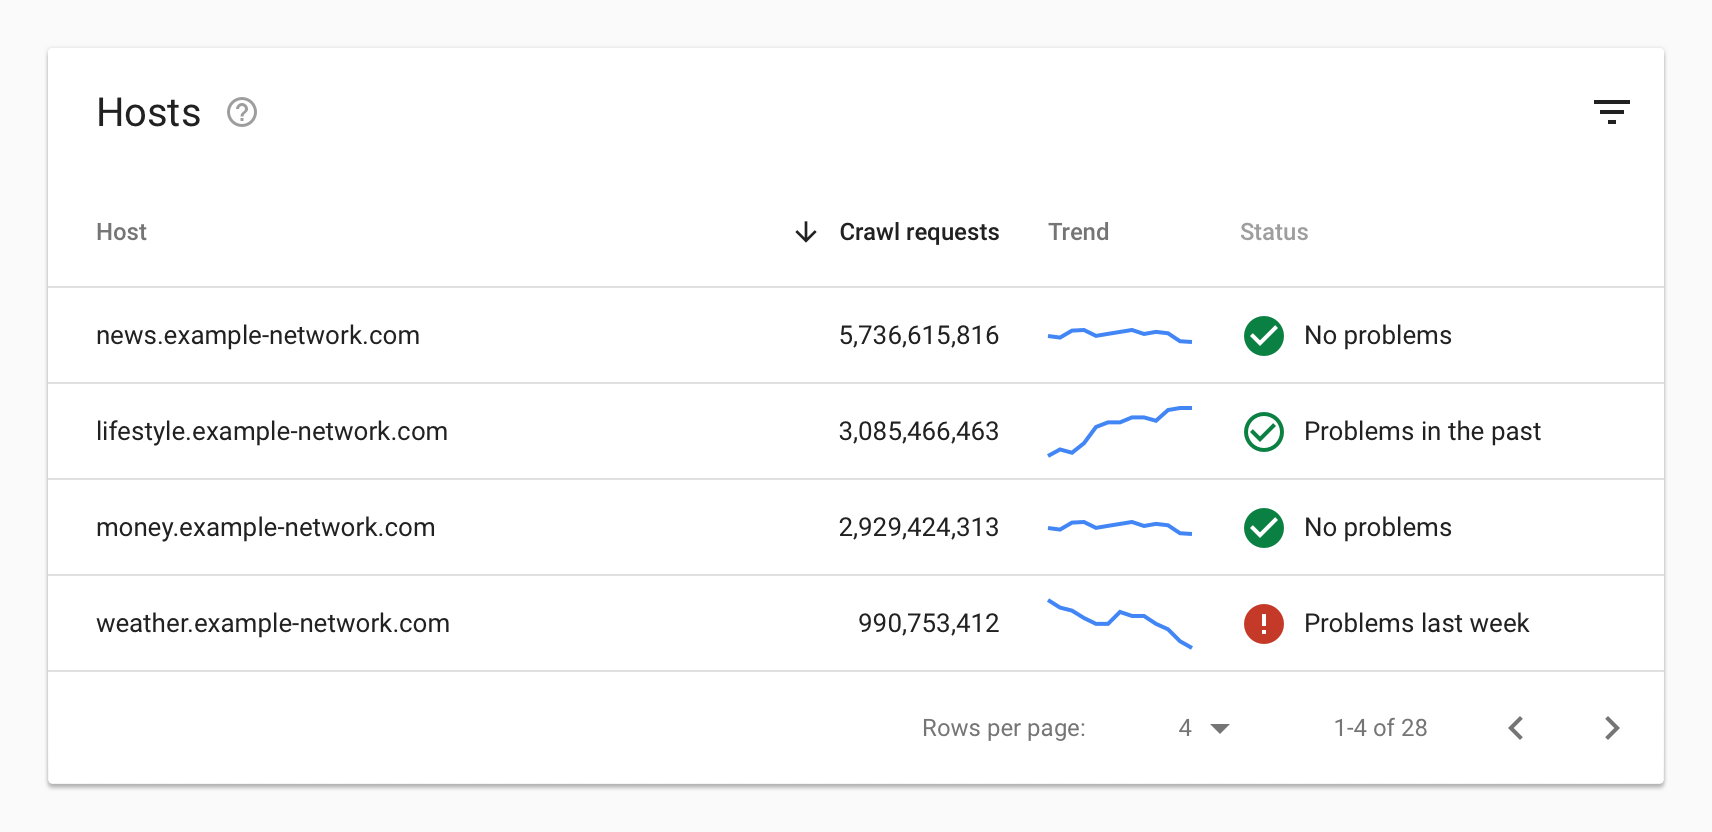
For domain properties with multiple hosts, you can check the host status for each of the top hosts presented in the report summary view. This can help you evaluate performance of all hosts under your domain in one place.

In summary, the new Crawl stats report will help you understand how Googlebot crawls your site:
- See Google’s crawling history in the overtime charts
- See the file types and file sizes returned by your site
- See crawl requests details in the example lists
- Track your site’s availability issues in the host status view
We hope you find the new data useful and actionable. For questions or comments on the report, feel free to drop by our Search Central help community, or mention us on Twitter. And make sure to check the Crawl stats report documentation, it has lots of details on what you can do with the new report.

